BOOK FIGURES AND DIAGRAMS

The Visual Companion

The figures and diagrams from The Human OS Manual, gathered in one place for easier reference.

Some ideas in the book are easier to see than to describe.

This companion brings the book's visual models together in one place, particularly for audiobook listeners and readers returning to a specific figure. Each figure appears with its book reference and the image description retained in the manuscript.

These are reference materials, not a separate version of the argument.

Visual index

FIGURE 3.1 · CHAPTER 3

The Friction Loop
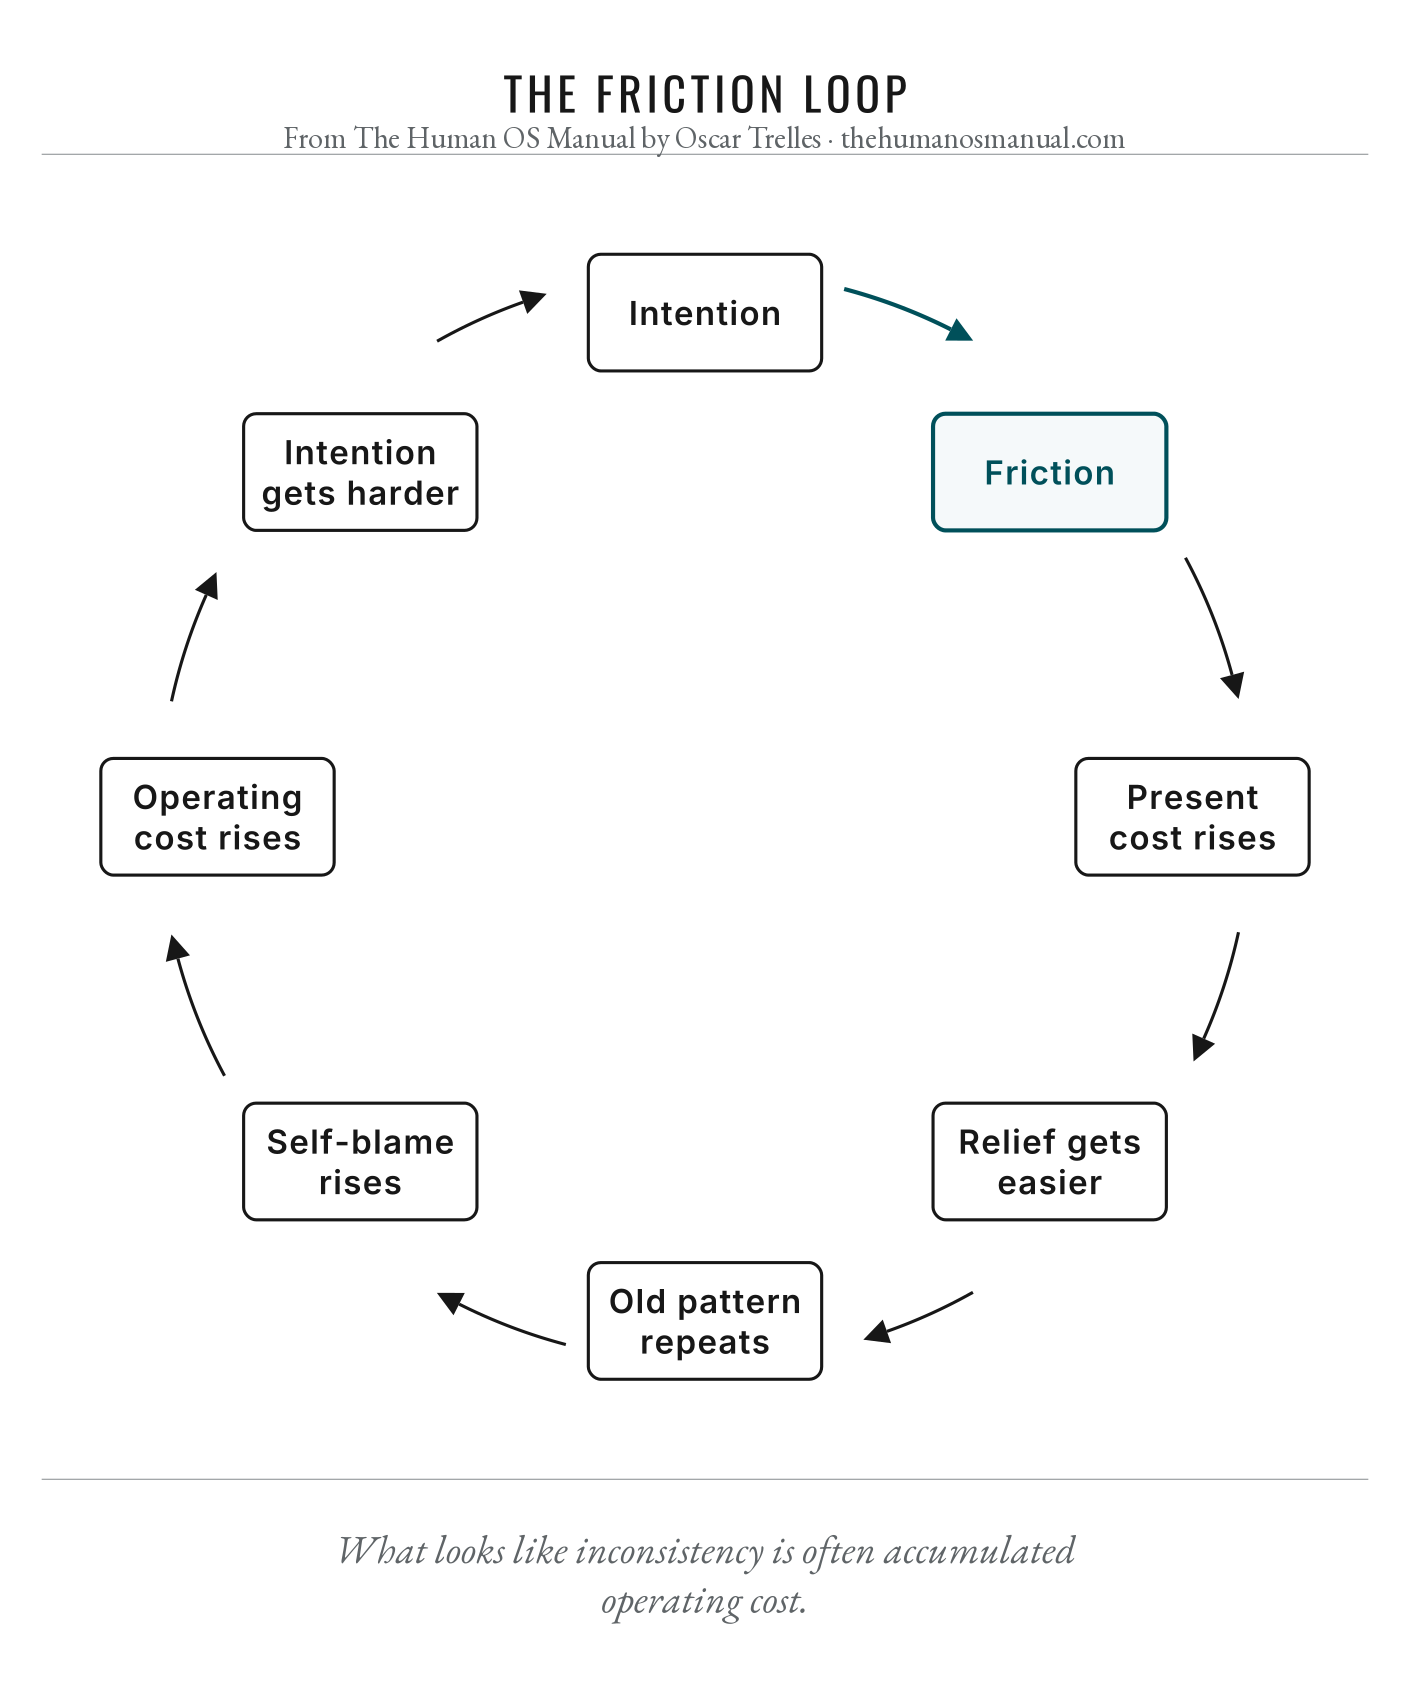
Figure 3.1, The Friction Loop. Detailed image description follows.

Image description

Diagram titled The Friction Loop. A circular sequence moves from intention to friction, pain builds, relief wins, old pattern returns, blame rises, higher cost, and weaker intent, showing inconsistency as accumulated operating cost.

In the book

Chapter 3 · The Real Problem Is Friction
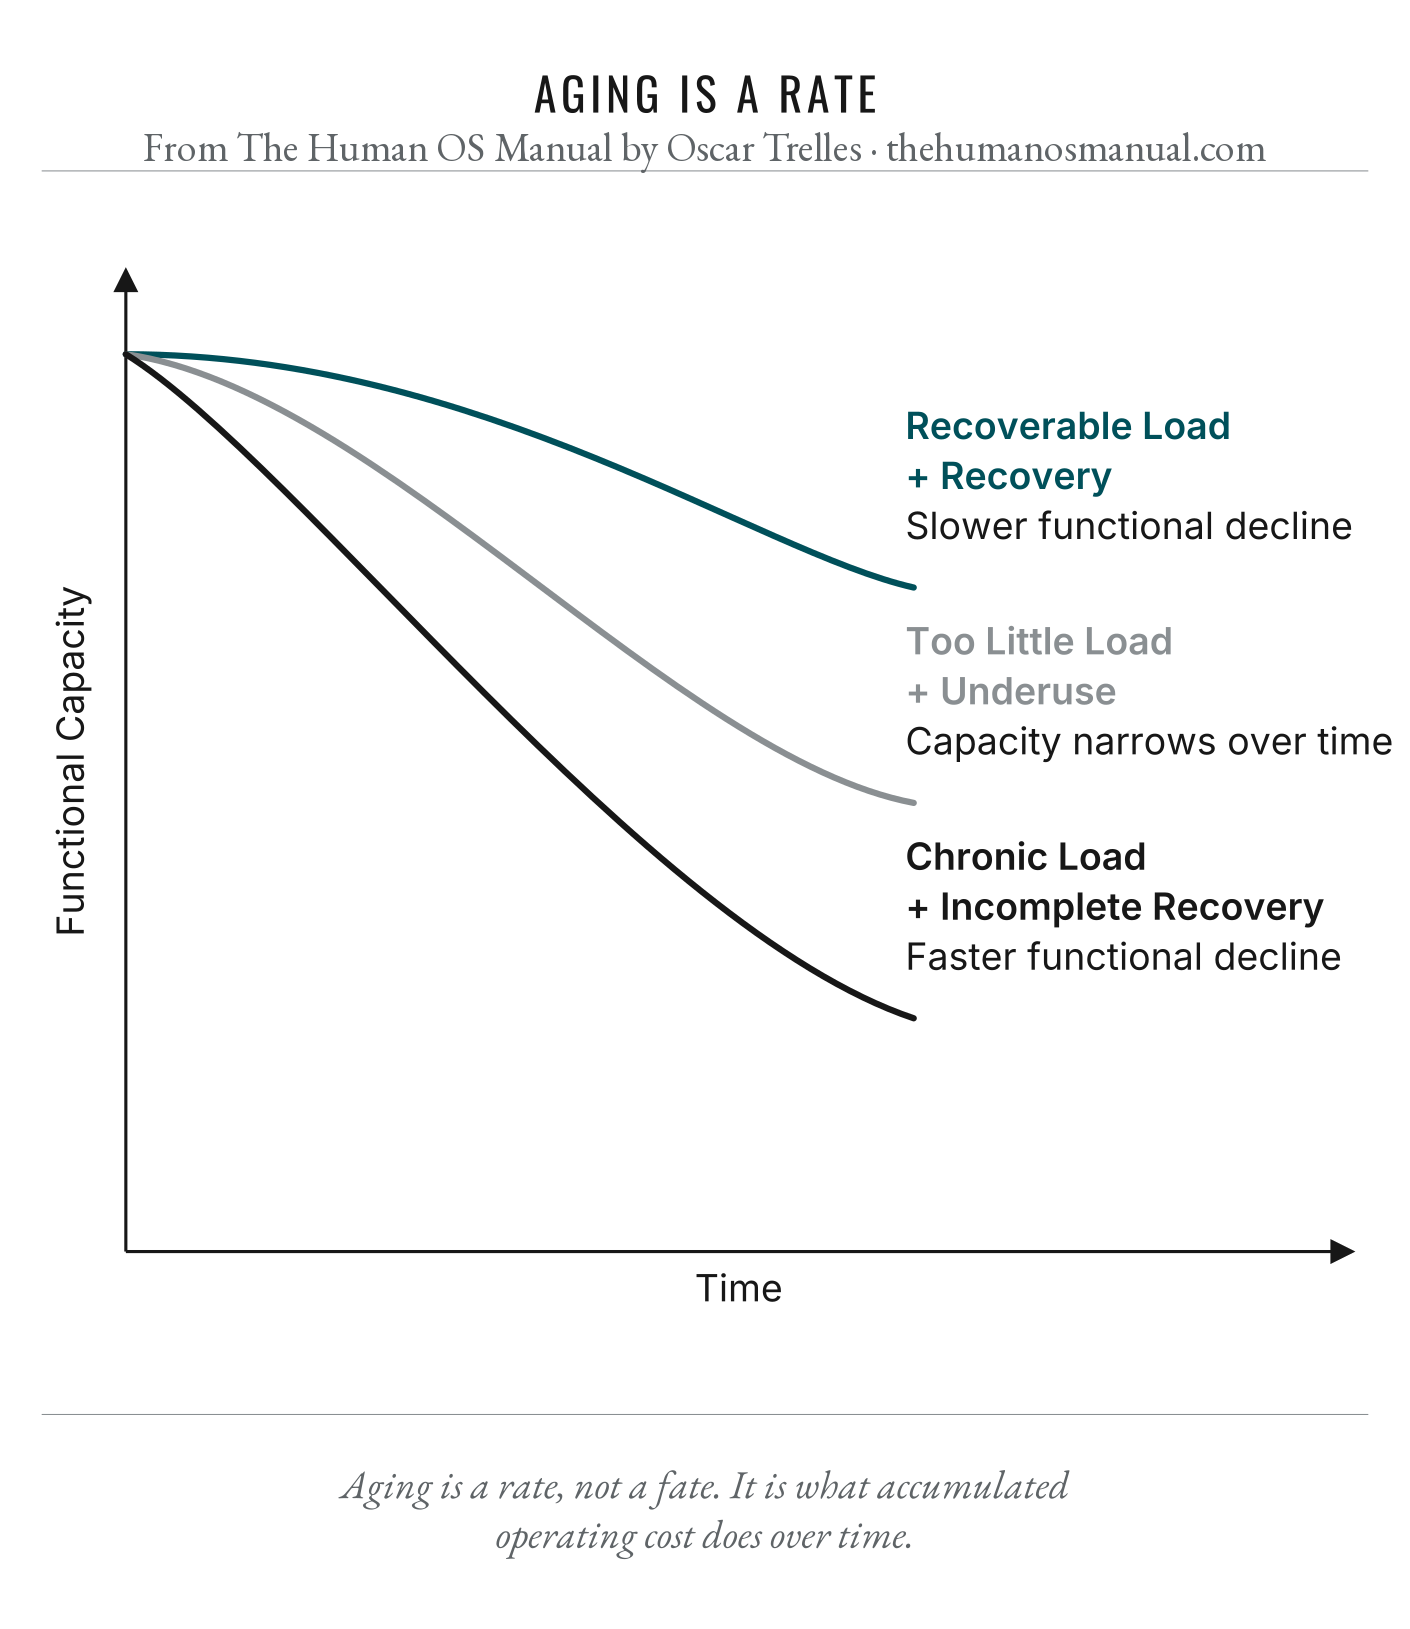
FIGURE 4.1 · CHAPTER 4

Aging Is A Rate

Figure 4.1, Aging Is A Rate. Detailed image description follows.

Image description

Diagram titled Aging Is a Rate. A graph plots functional capacity over time, comparing coherent load plus recovery with slower decline, underchallenge or overprotection with gradual narrowing, and chronic load plus incomplete recovery with faster decline.

In the book

Chapter 4 · Aging Is a Rate, Not a Fate

FIGURE 5.1 · CHAPTER 5

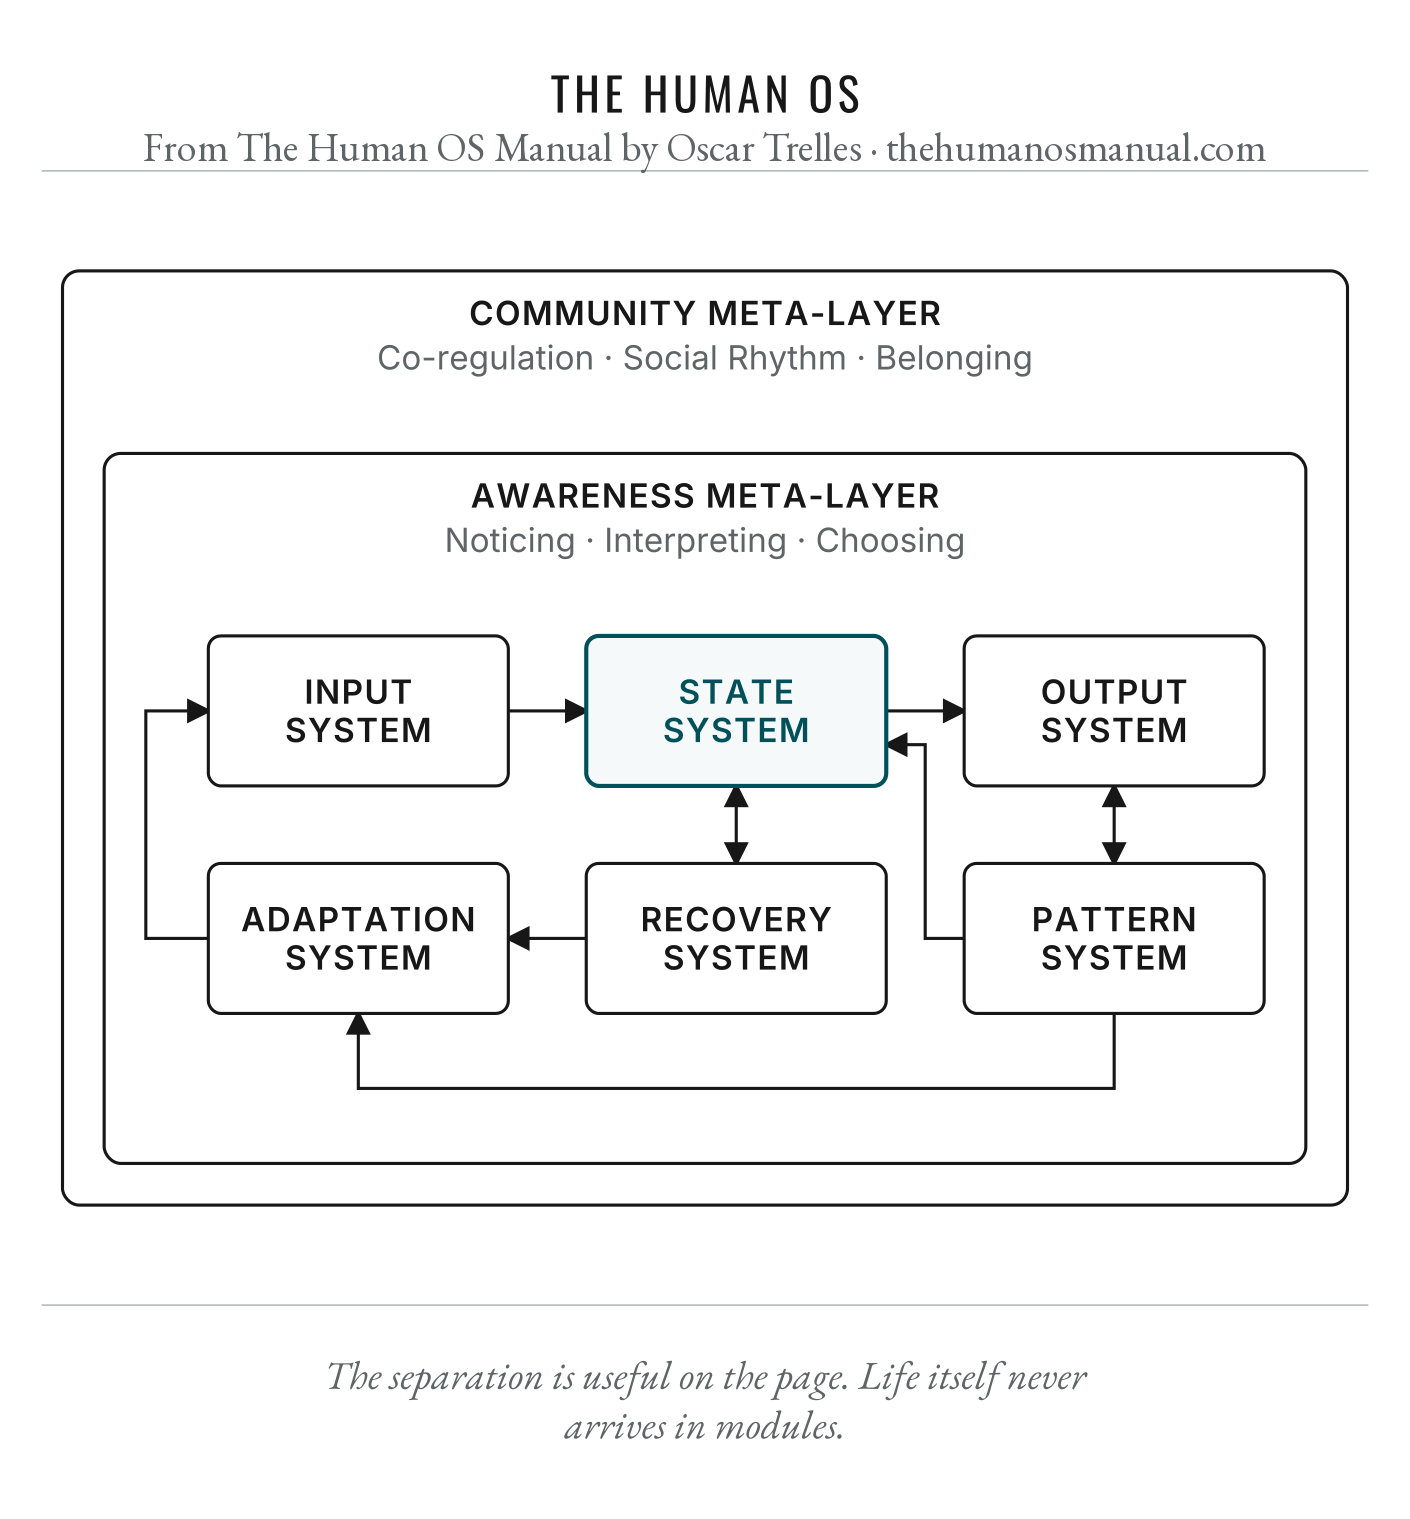
The Human Os

Figure 5.1, The Human Os. Detailed image description follows.

Image description

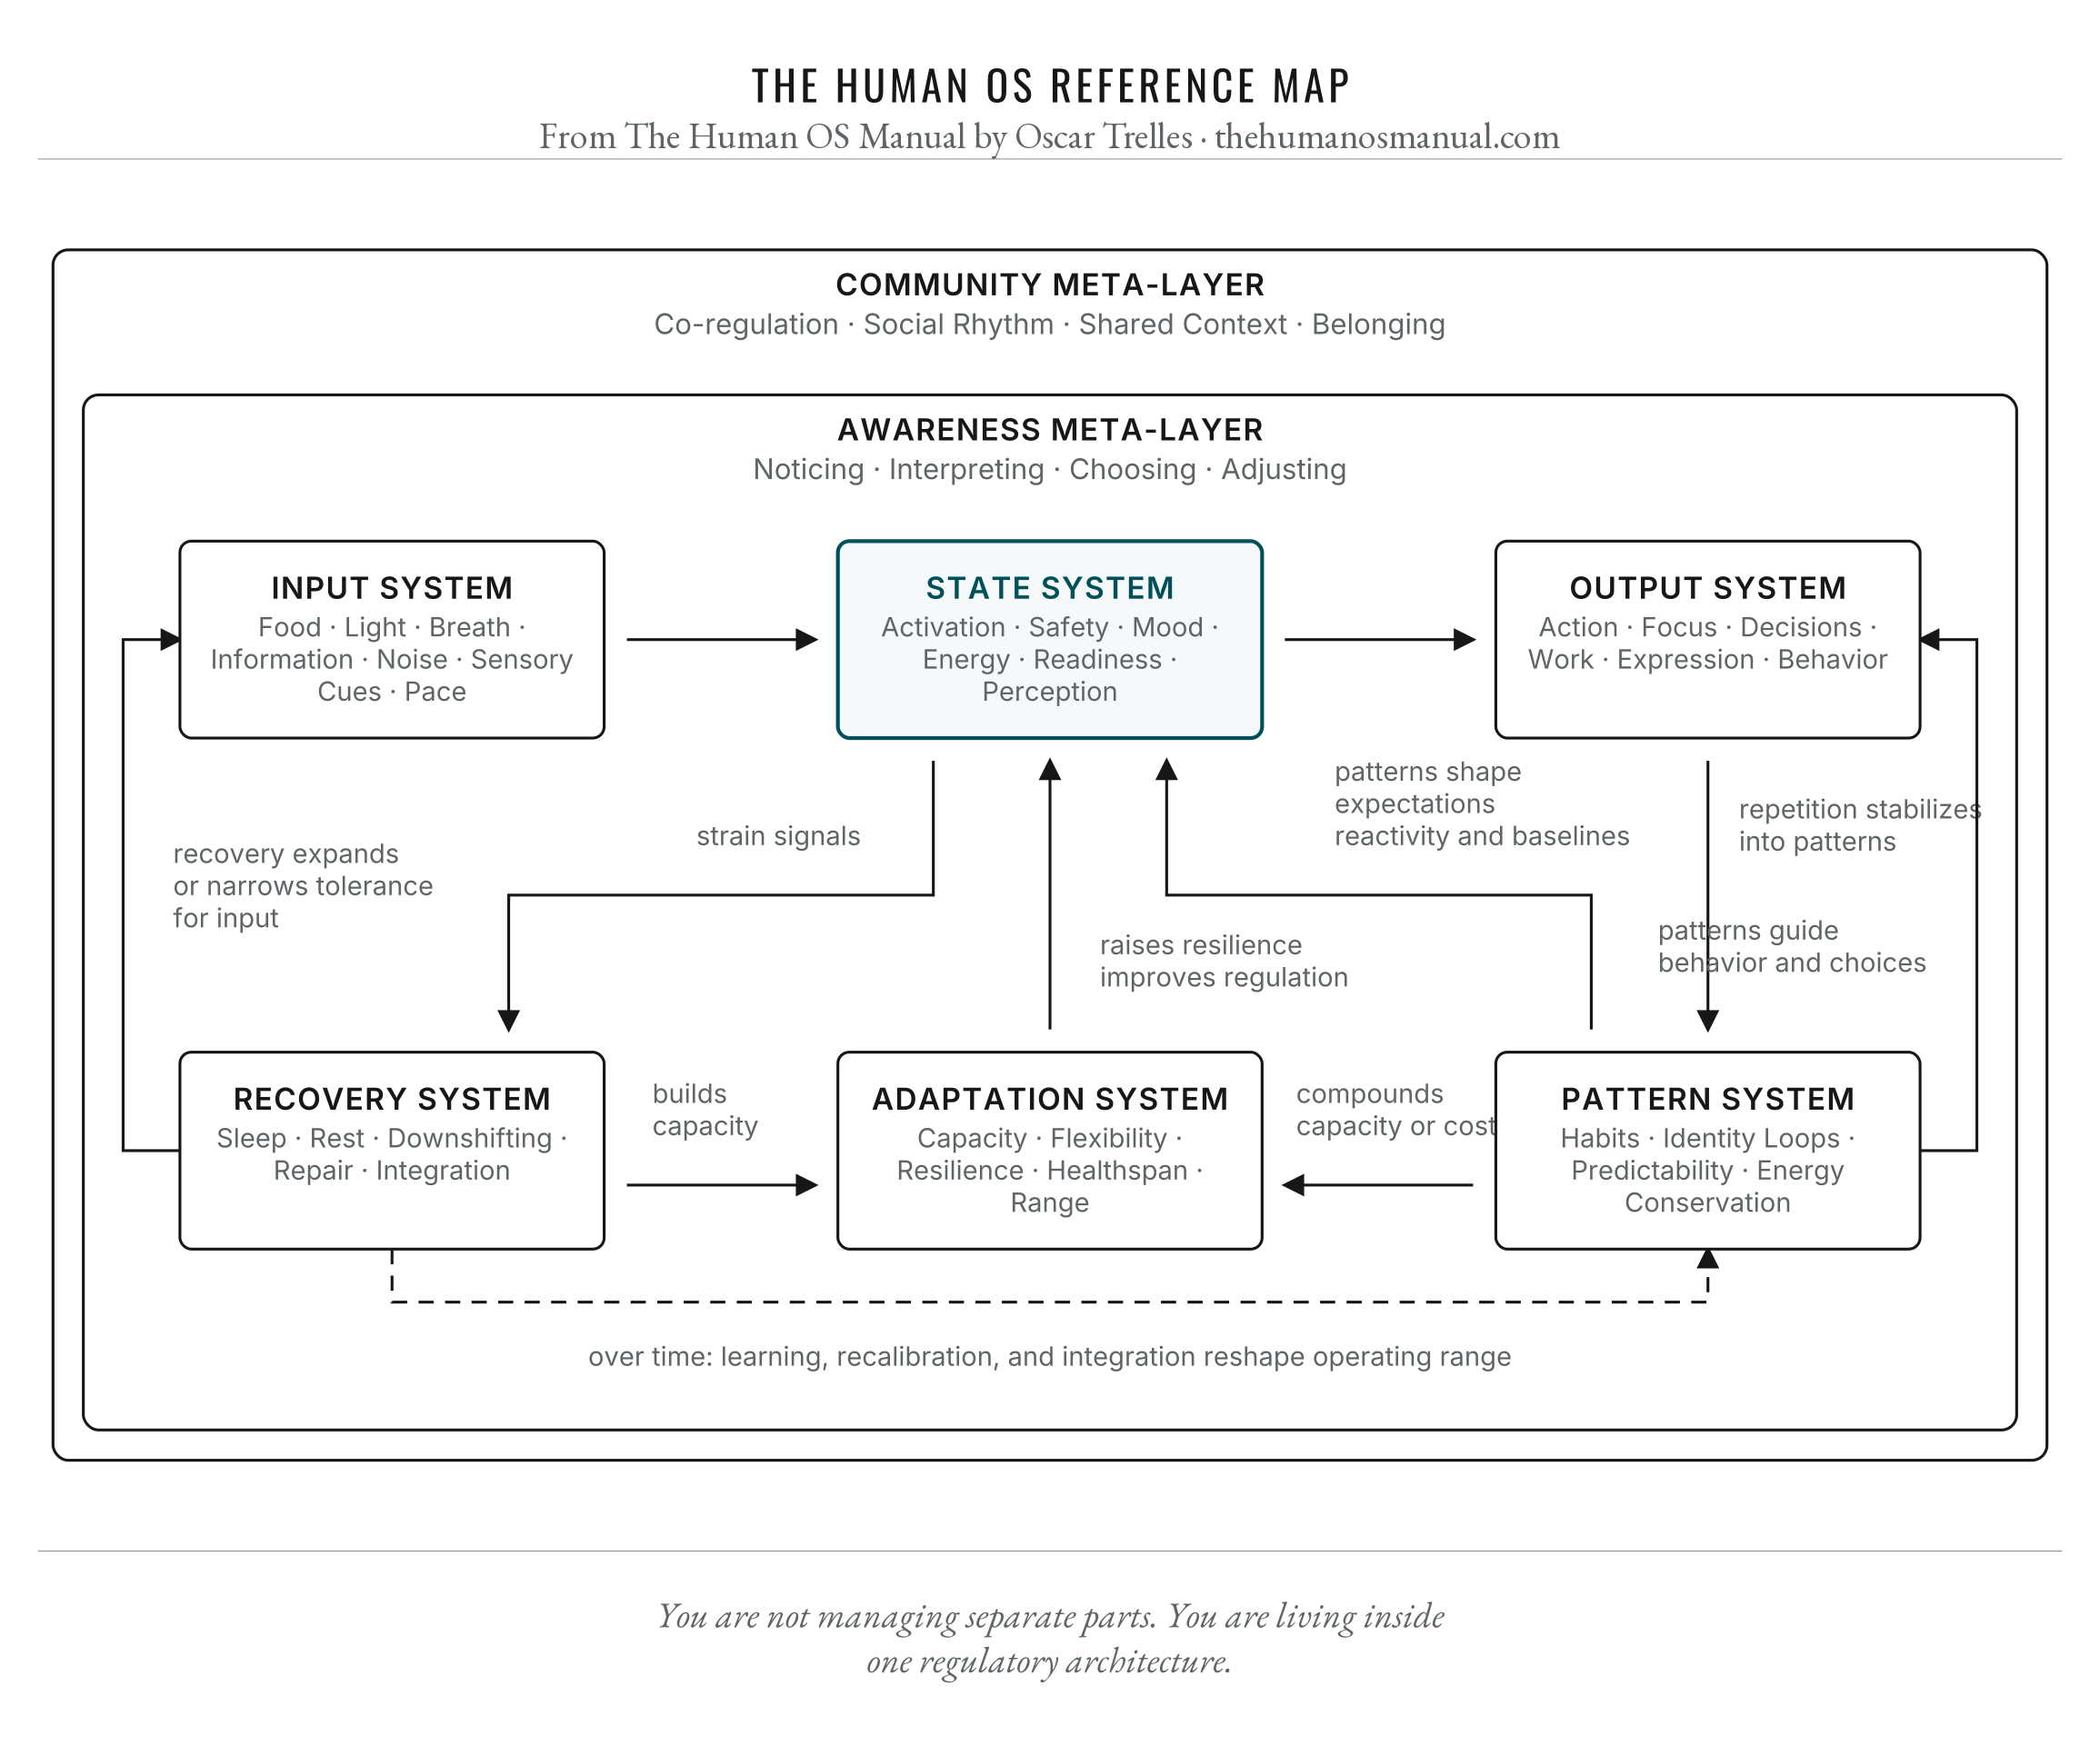
Diagram titled The Human OS. Input, state, output, recovery, pattern, and adaptation systems interact inside awareness and community meta-layers, showing human functioning as one connected architecture rather than separate parts.

In the book

Chapter 5 · The Human OS: How the System Is Structured

FIGURE 7.1 · CHAPTER 7

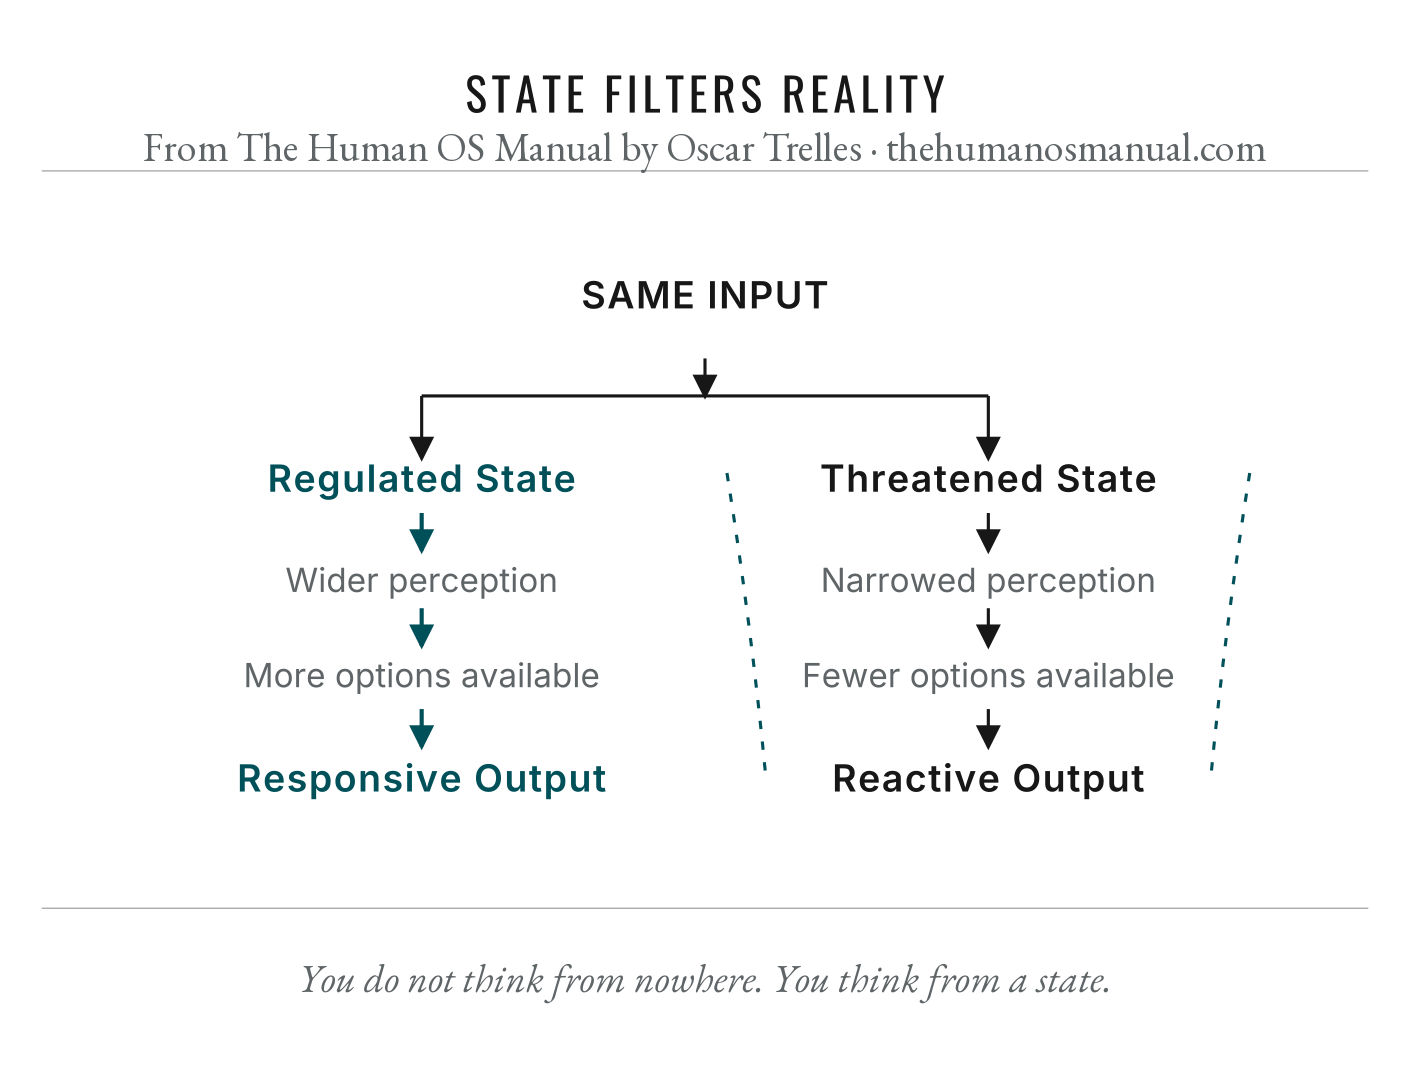
State Filters Reality

Figure 7.1, State Filters Reality. Detailed image description follows.

Image description

Diagram titled State Filters Reality. The same input splits into two pathways: a regulated state creates wider perception, more available options, and responsive output; a threatened state creates narrowed perception, fewer options, and reactive output.

In the book

Chapter 7 · The State System

FIGURE 8.1 · CHAPTER 8

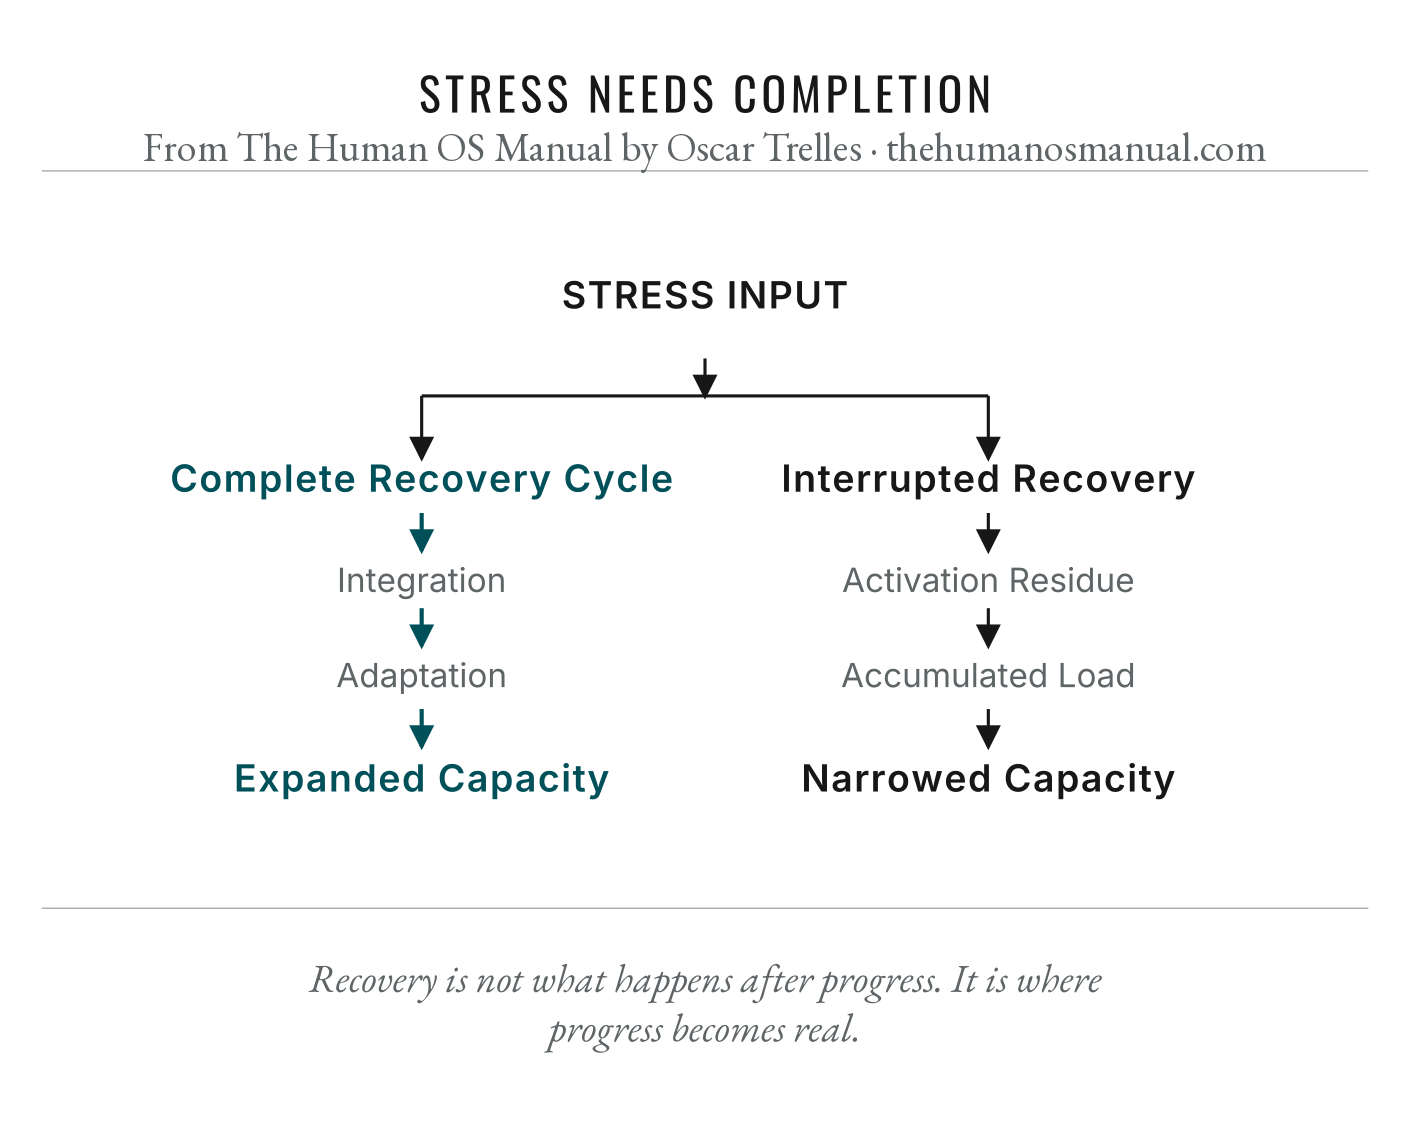
Stress Needs Completion

Figure 8.1, Stress Needs Completion. Detailed image description follows.

Image description

Diagram titled Stress Needs Completion. Sufficient recovery supports integration, adaptation, and expanded capacity; insufficient or repeatedly interrupted recovery leaves more residual activation, accumulated load, and narrowed capacity.

In the book

Chapter 8 · The Recovery System

FIGURE 9.1 · CHAPTER 9

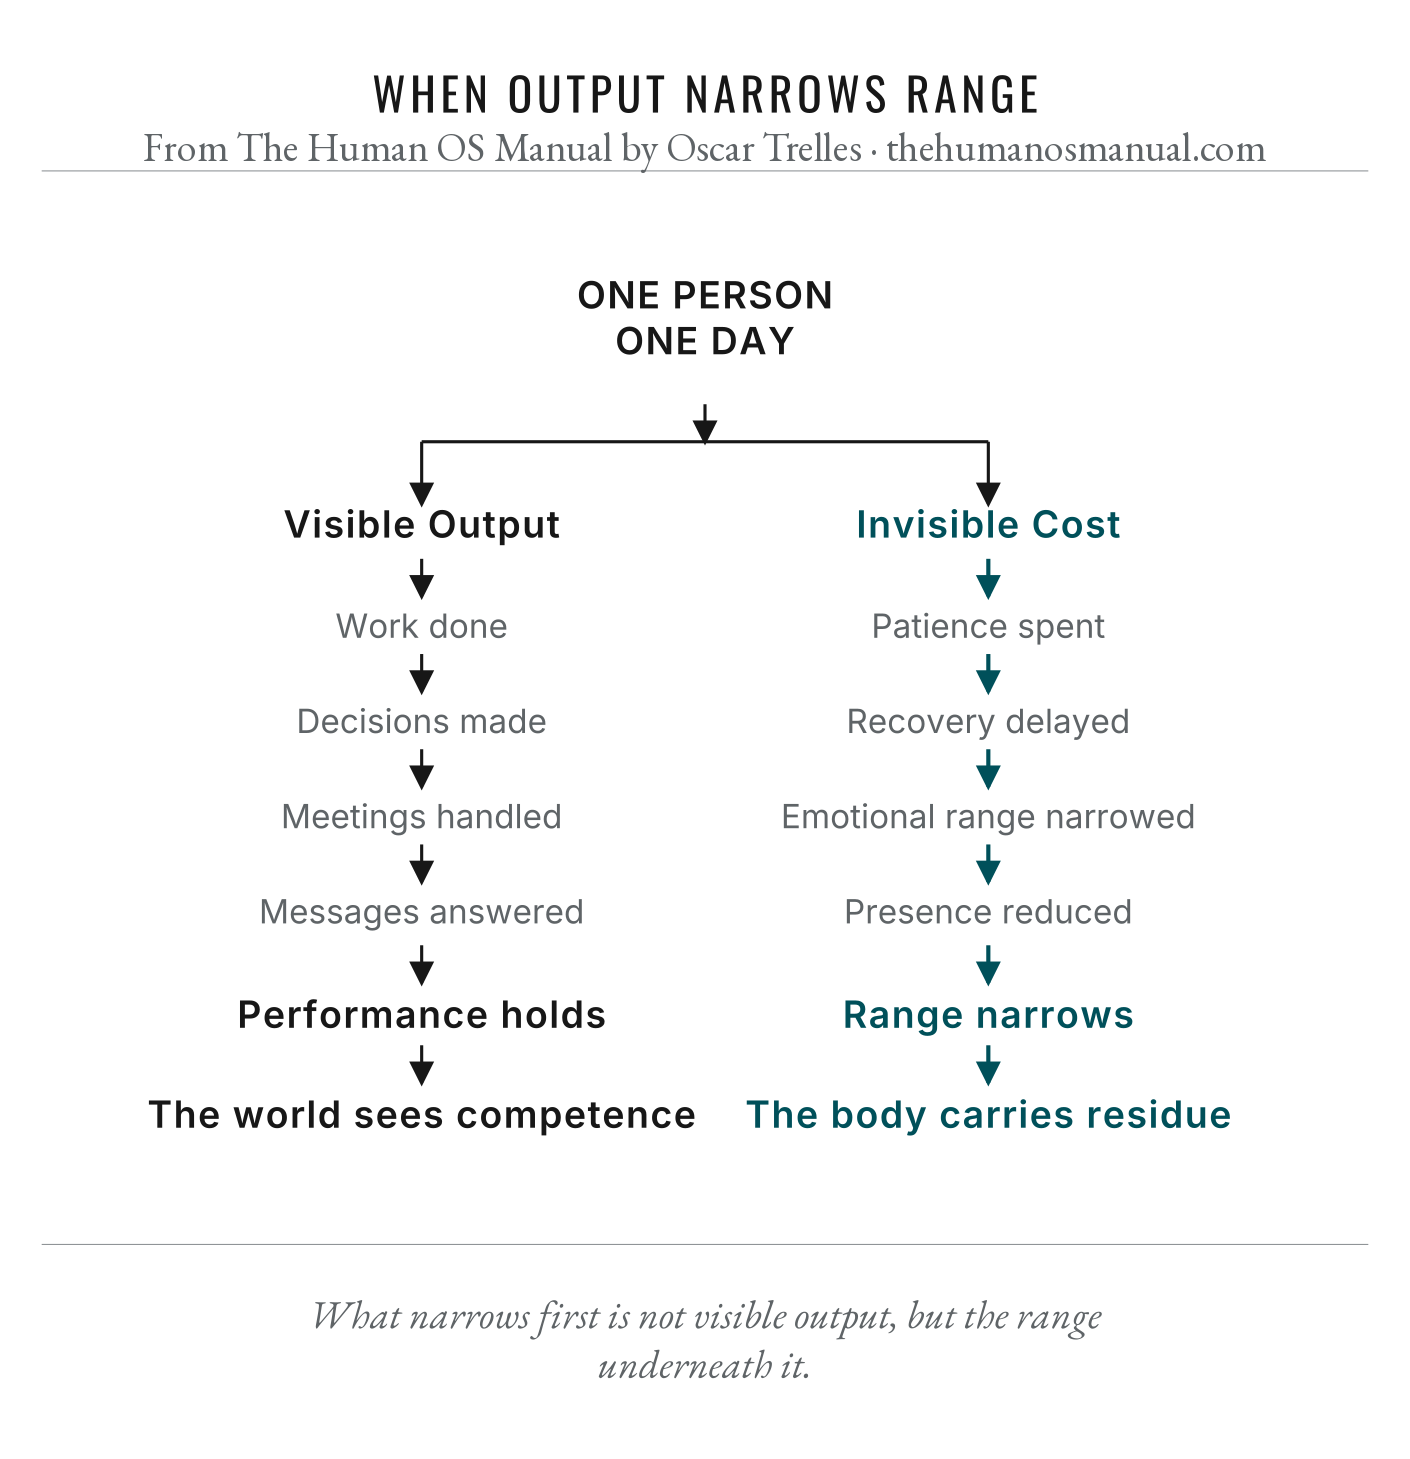
When Output Narrows Range

Figure 9.1, When Output Narrows Range. Detailed image description follows.

Image description

Diagram titled When Output Narrows Range. A single day shows visible output—work, decisions, meetings, and messages—while invisible costs accumulate in patience, recovery, emotional range, and presence, narrowing range underneath performance.

In the book

Chapter 9 · The Output System

FIGURE 10.1 · CHAPTER 10

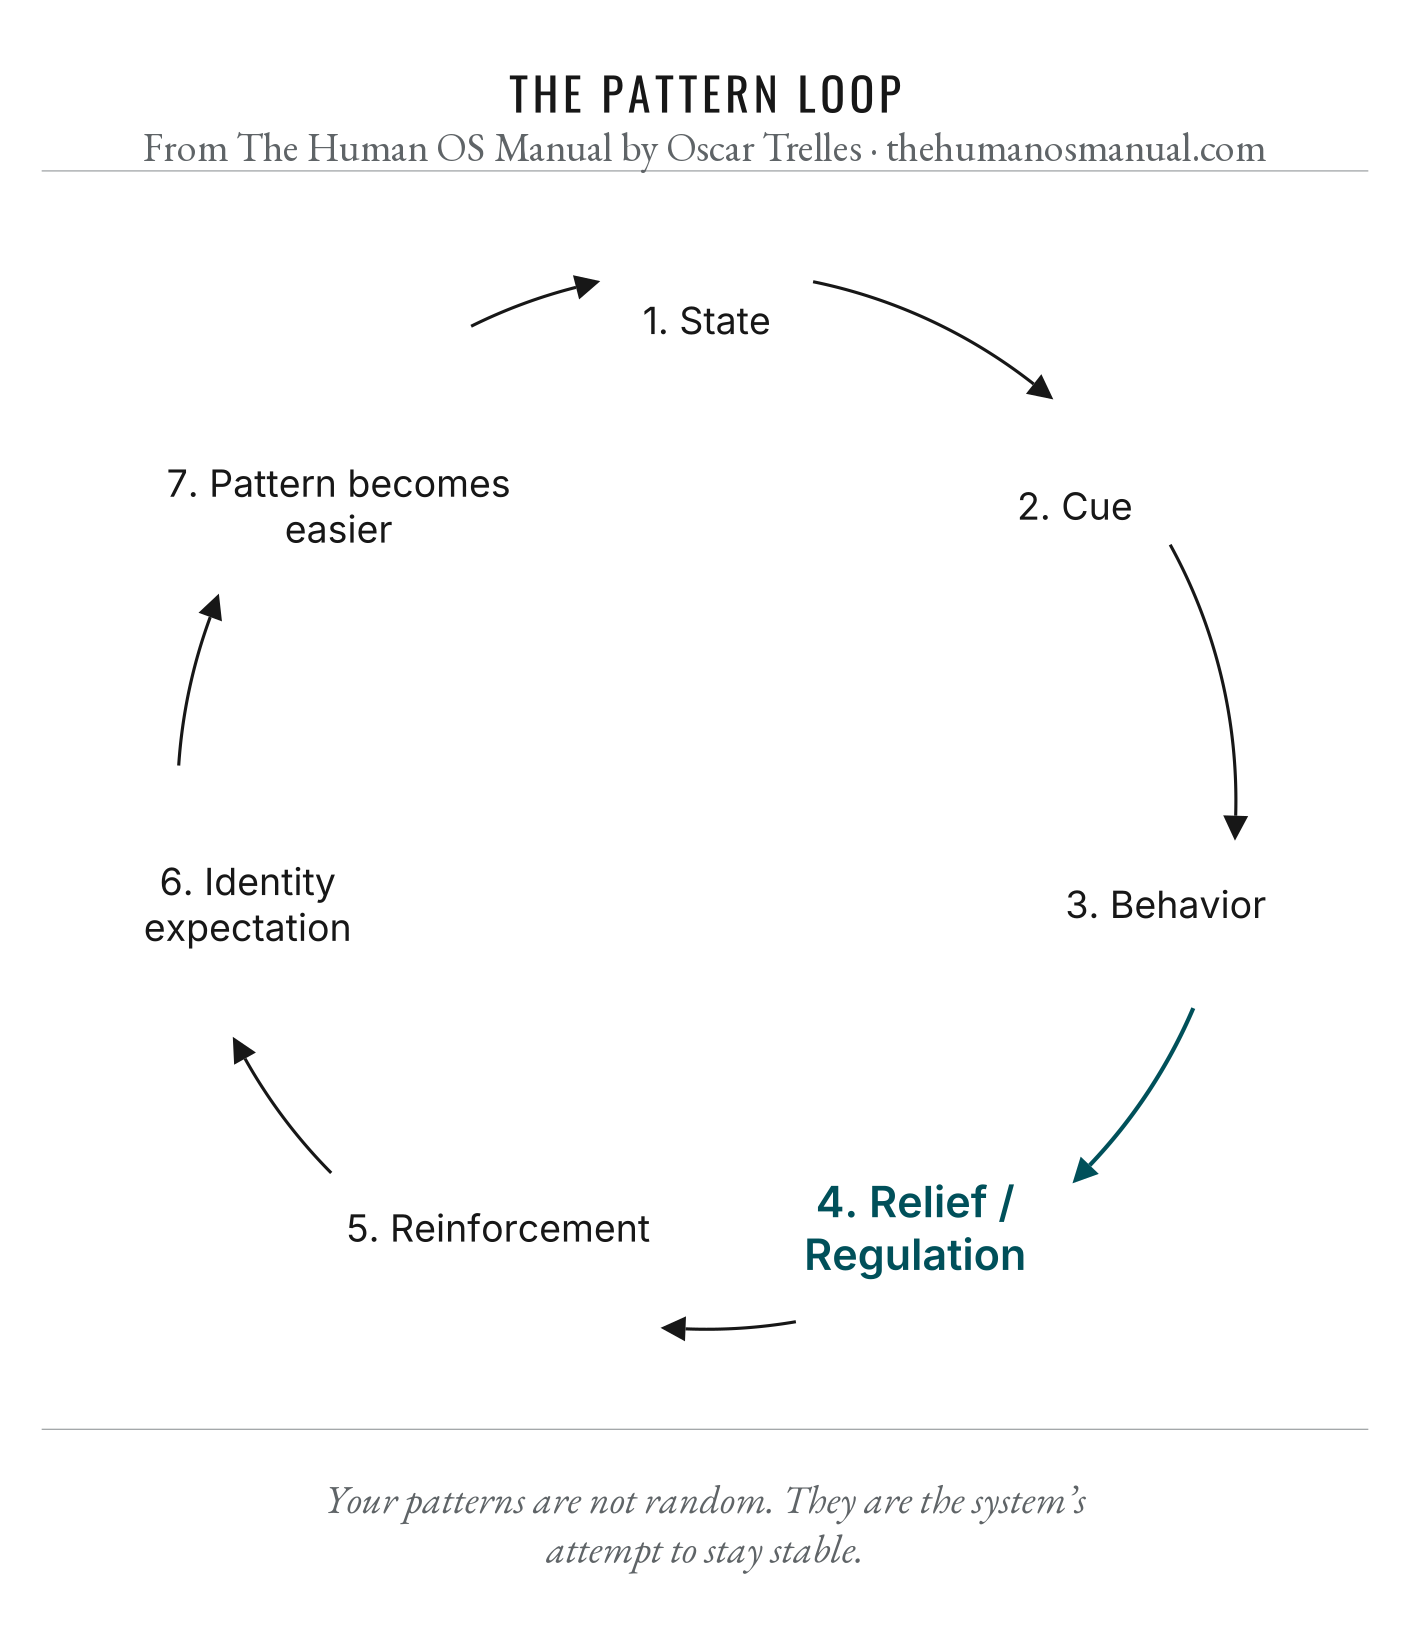
The Pattern Loop

Figure 10.1, The Pattern Loop. Detailed image description follows.

Image description

Diagram titled The Pattern Loop. A cycle moves through state, cue, behavior, short-term relief, reinforcement, identity expectation, and easier repetition, showing how a familiar response becomes more available under similar conditions.

In the book

Chapter 10 · The Pattern System

FIGURE 11.1 · CHAPTER 11

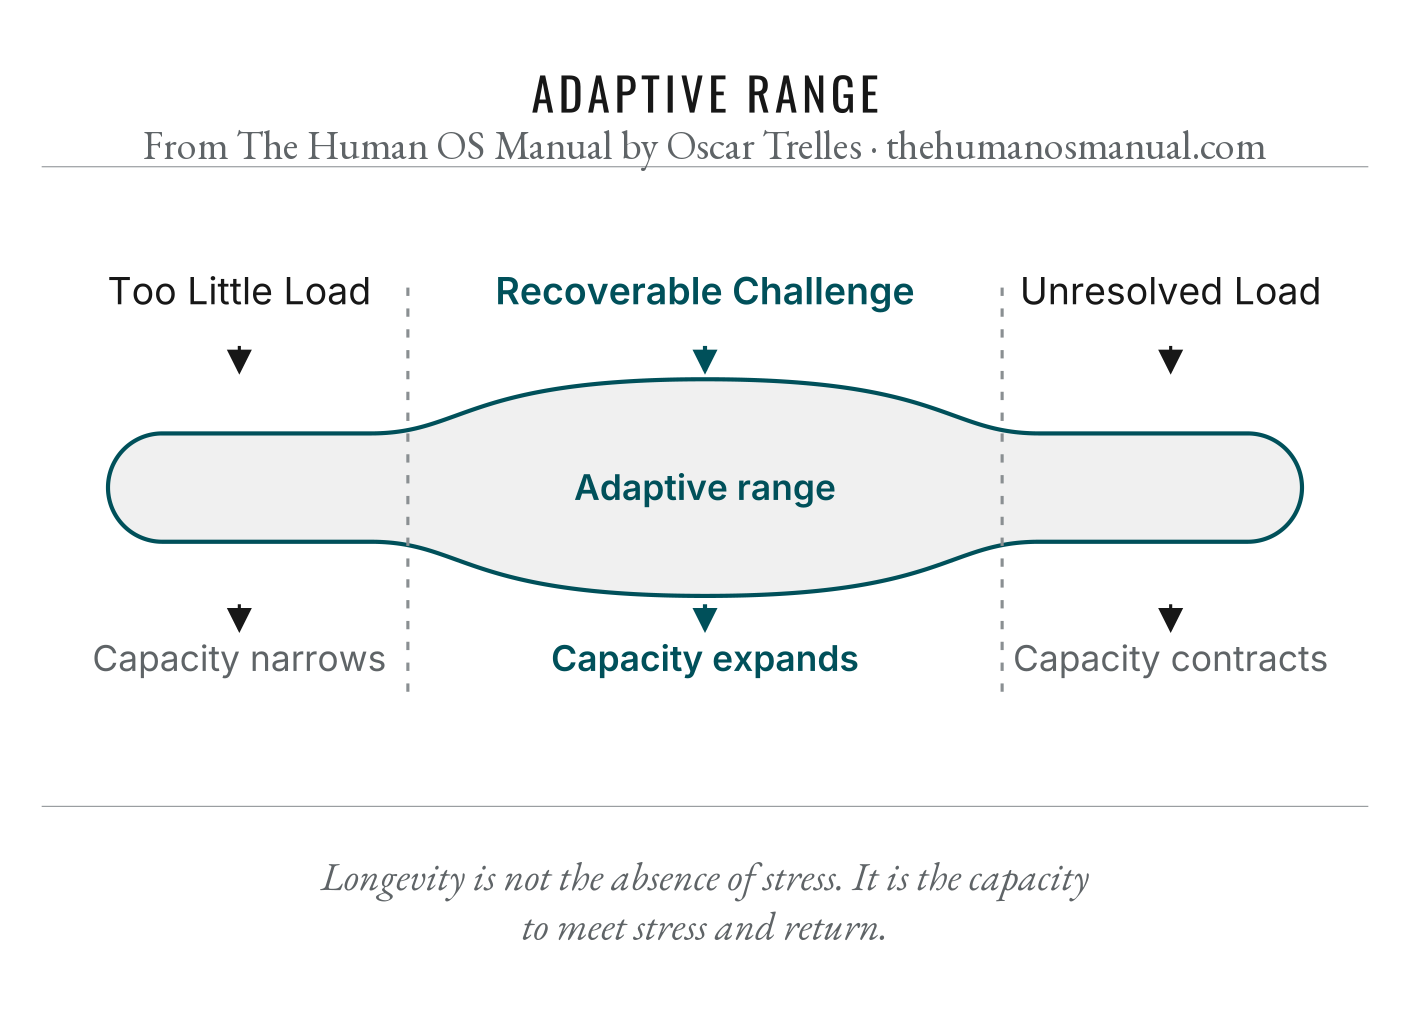
Adaptive Range

Figure 11.1, Adaptive Range. Detailed image description follows.

Image description

Diagram titled Adaptive Range. A curve compares too little challenge, useful challenge, and overload: capacity narrows with underchallenge, expands with useful challenge, and contracts under overload.

In the book

Chapter 11 · The Adaptation System

FIGURE 15.1 · CHAPTER 15

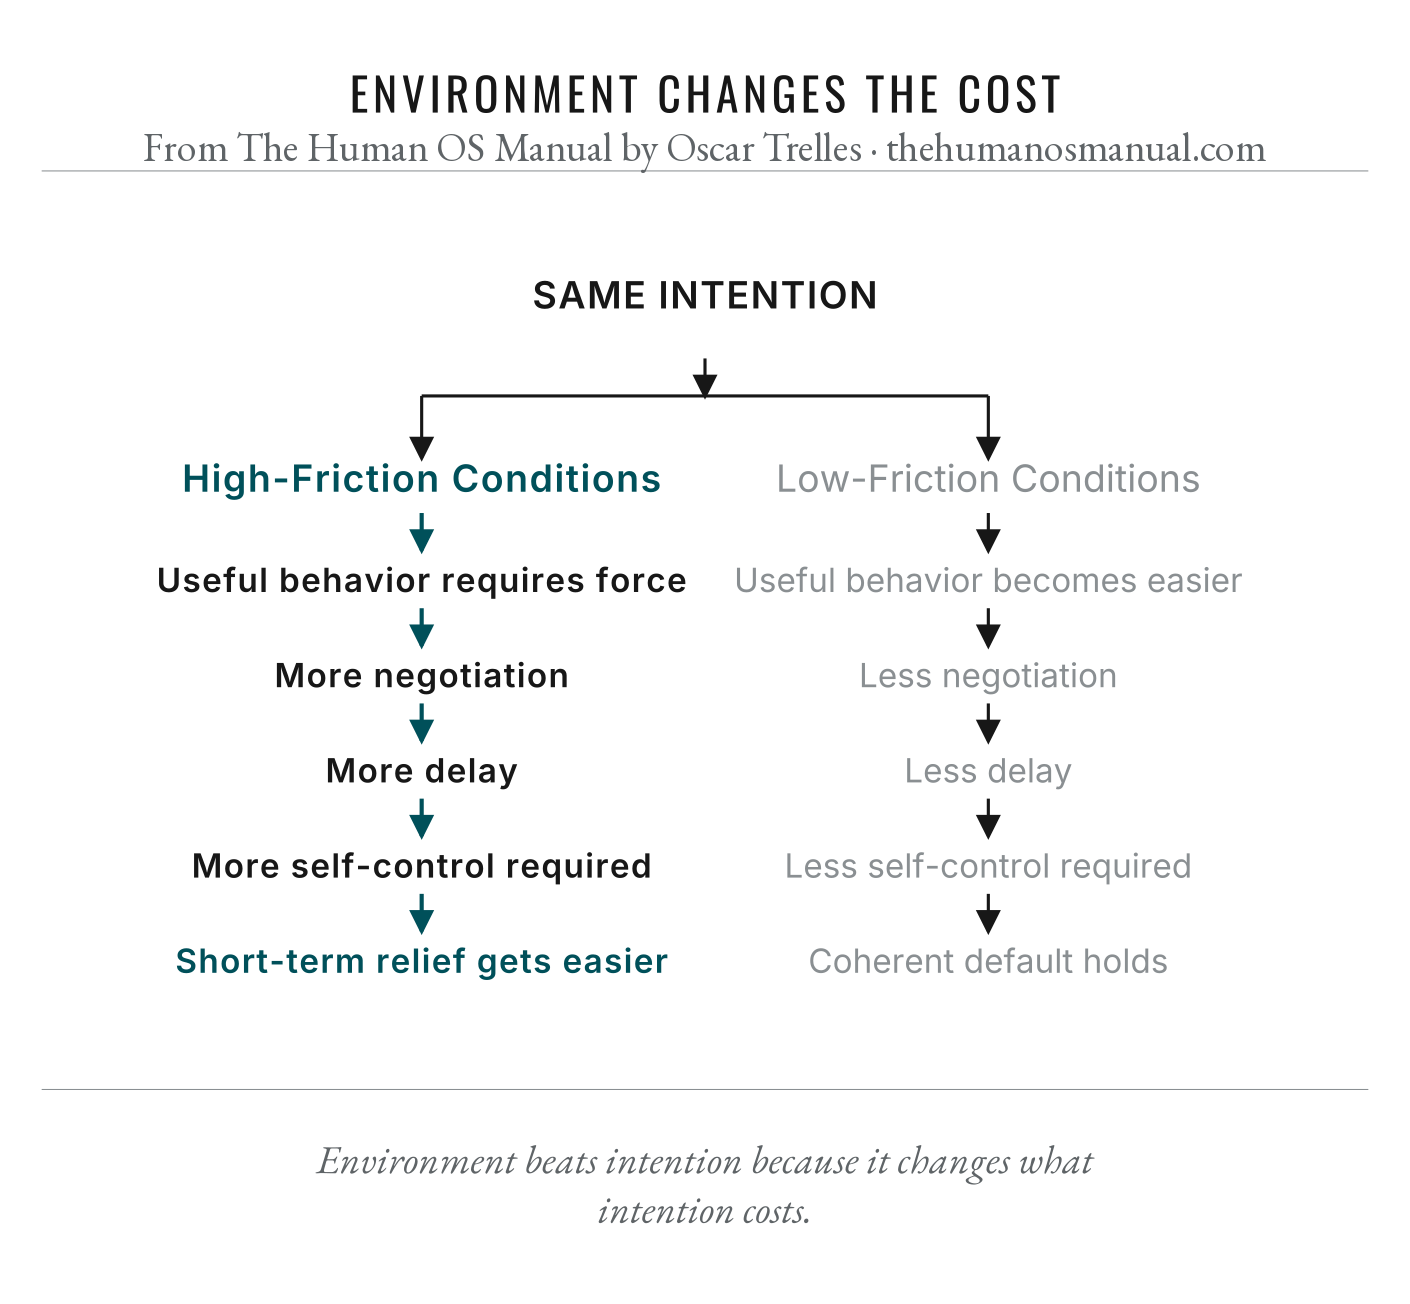
Environment Changes The Cost

Figure 15.1, Environment Changes The Cost. Detailed image description follows.

Image description

Diagram titled Environment Changes the Cost. The same intention appears inside two different arrangements. In one, interruption, negotiation, social pressure, and unresolved load make the coherent response expensive. In the other, fewer contradictions allow the response to occur with less repeated override.

In the book

Chapter 15 · Making Change Cheaper to Repeat

FIGURE 21.1 · CHAPTER 21

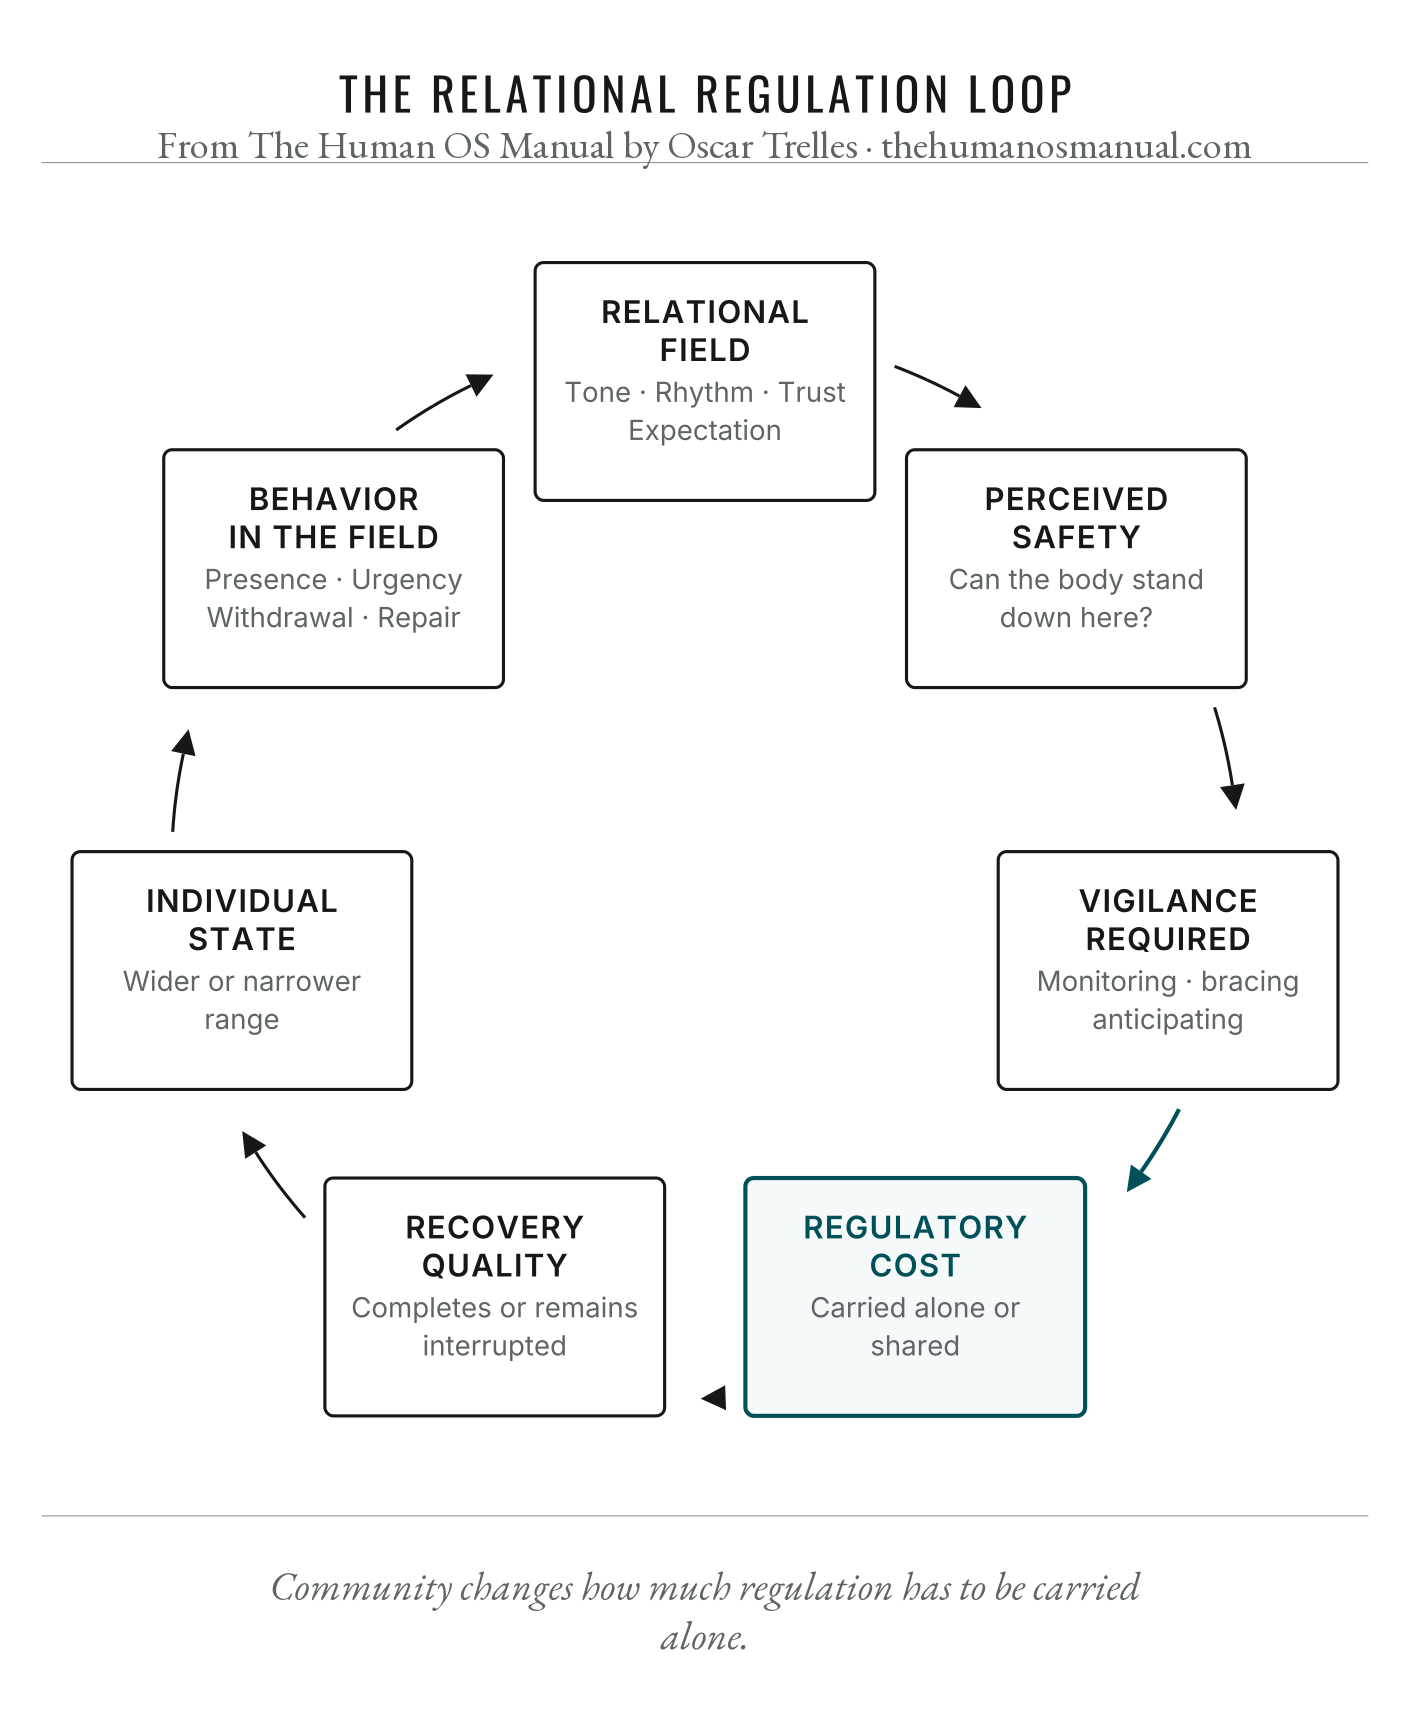
The Relational Regulation Loop

Figure 21.1, The Relational Regulation Loop. Detailed image description follows.

Image description

Diagram titled The Relational Regulation Loop. The relational field shapes perceived safety, vigilance required, regulatory cost, recovery quality, individual state, and behavior back into the field, showing how community changes what regulation costs.

In the book

Chapter 21 · Community as Infrastructure

FIGURE 22.1 · CHAPTER 22

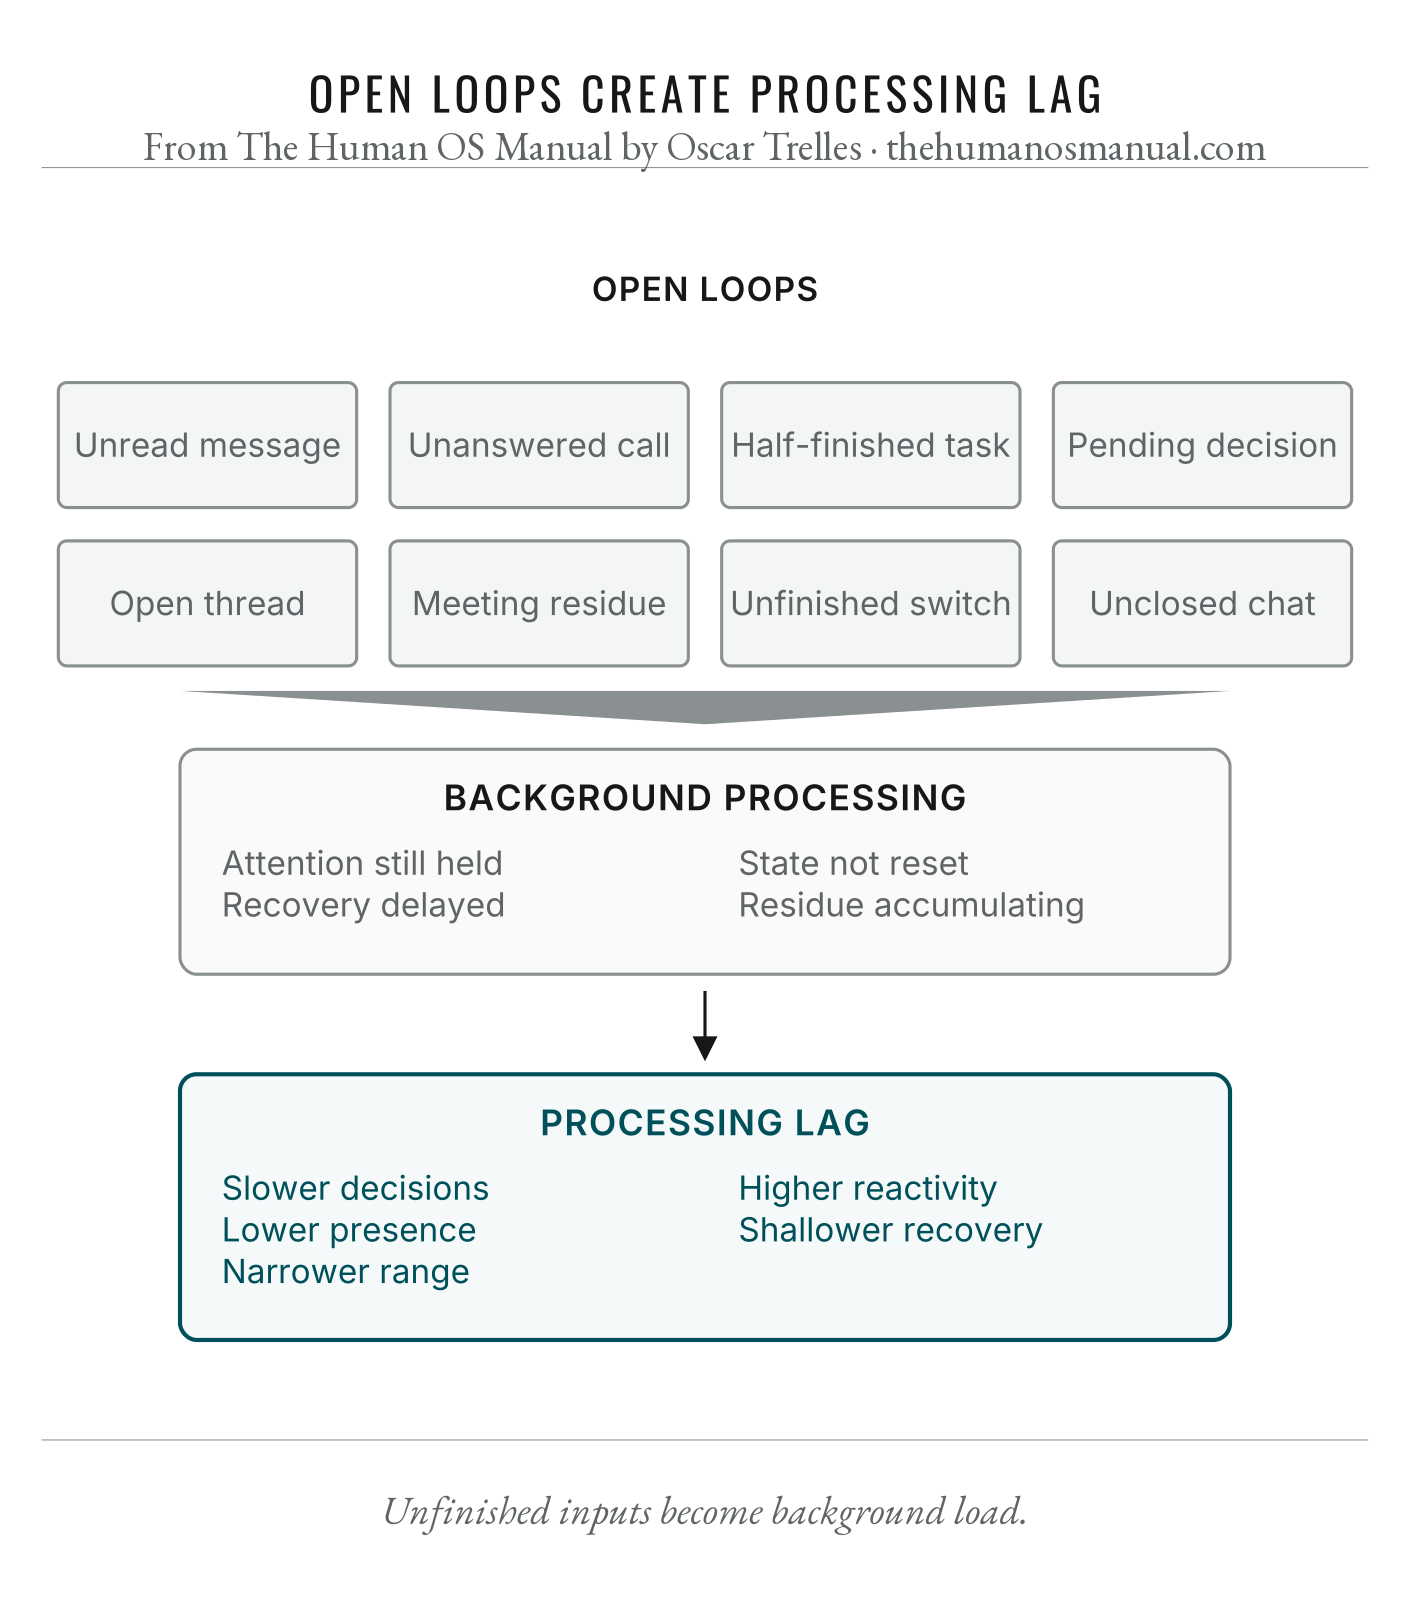
Open Loops Create Processing Lag

Figure 22.1, Open Loops Create Processing Lag. Detailed image description follows.

Image description

Diagram titled Open Loops Create Processing Lag. Unread messages, unresolved replies, half-finished tasks, pending decisions, open tabs, meetings, and unclosed conversations keep background processing active, delaying recovery and reducing presence, decisions, and adaptive range.

In the book

Chapter 22 · Building a Rhythm the Body Can Trust

FIGURE 22.2 · CHAPTER 22

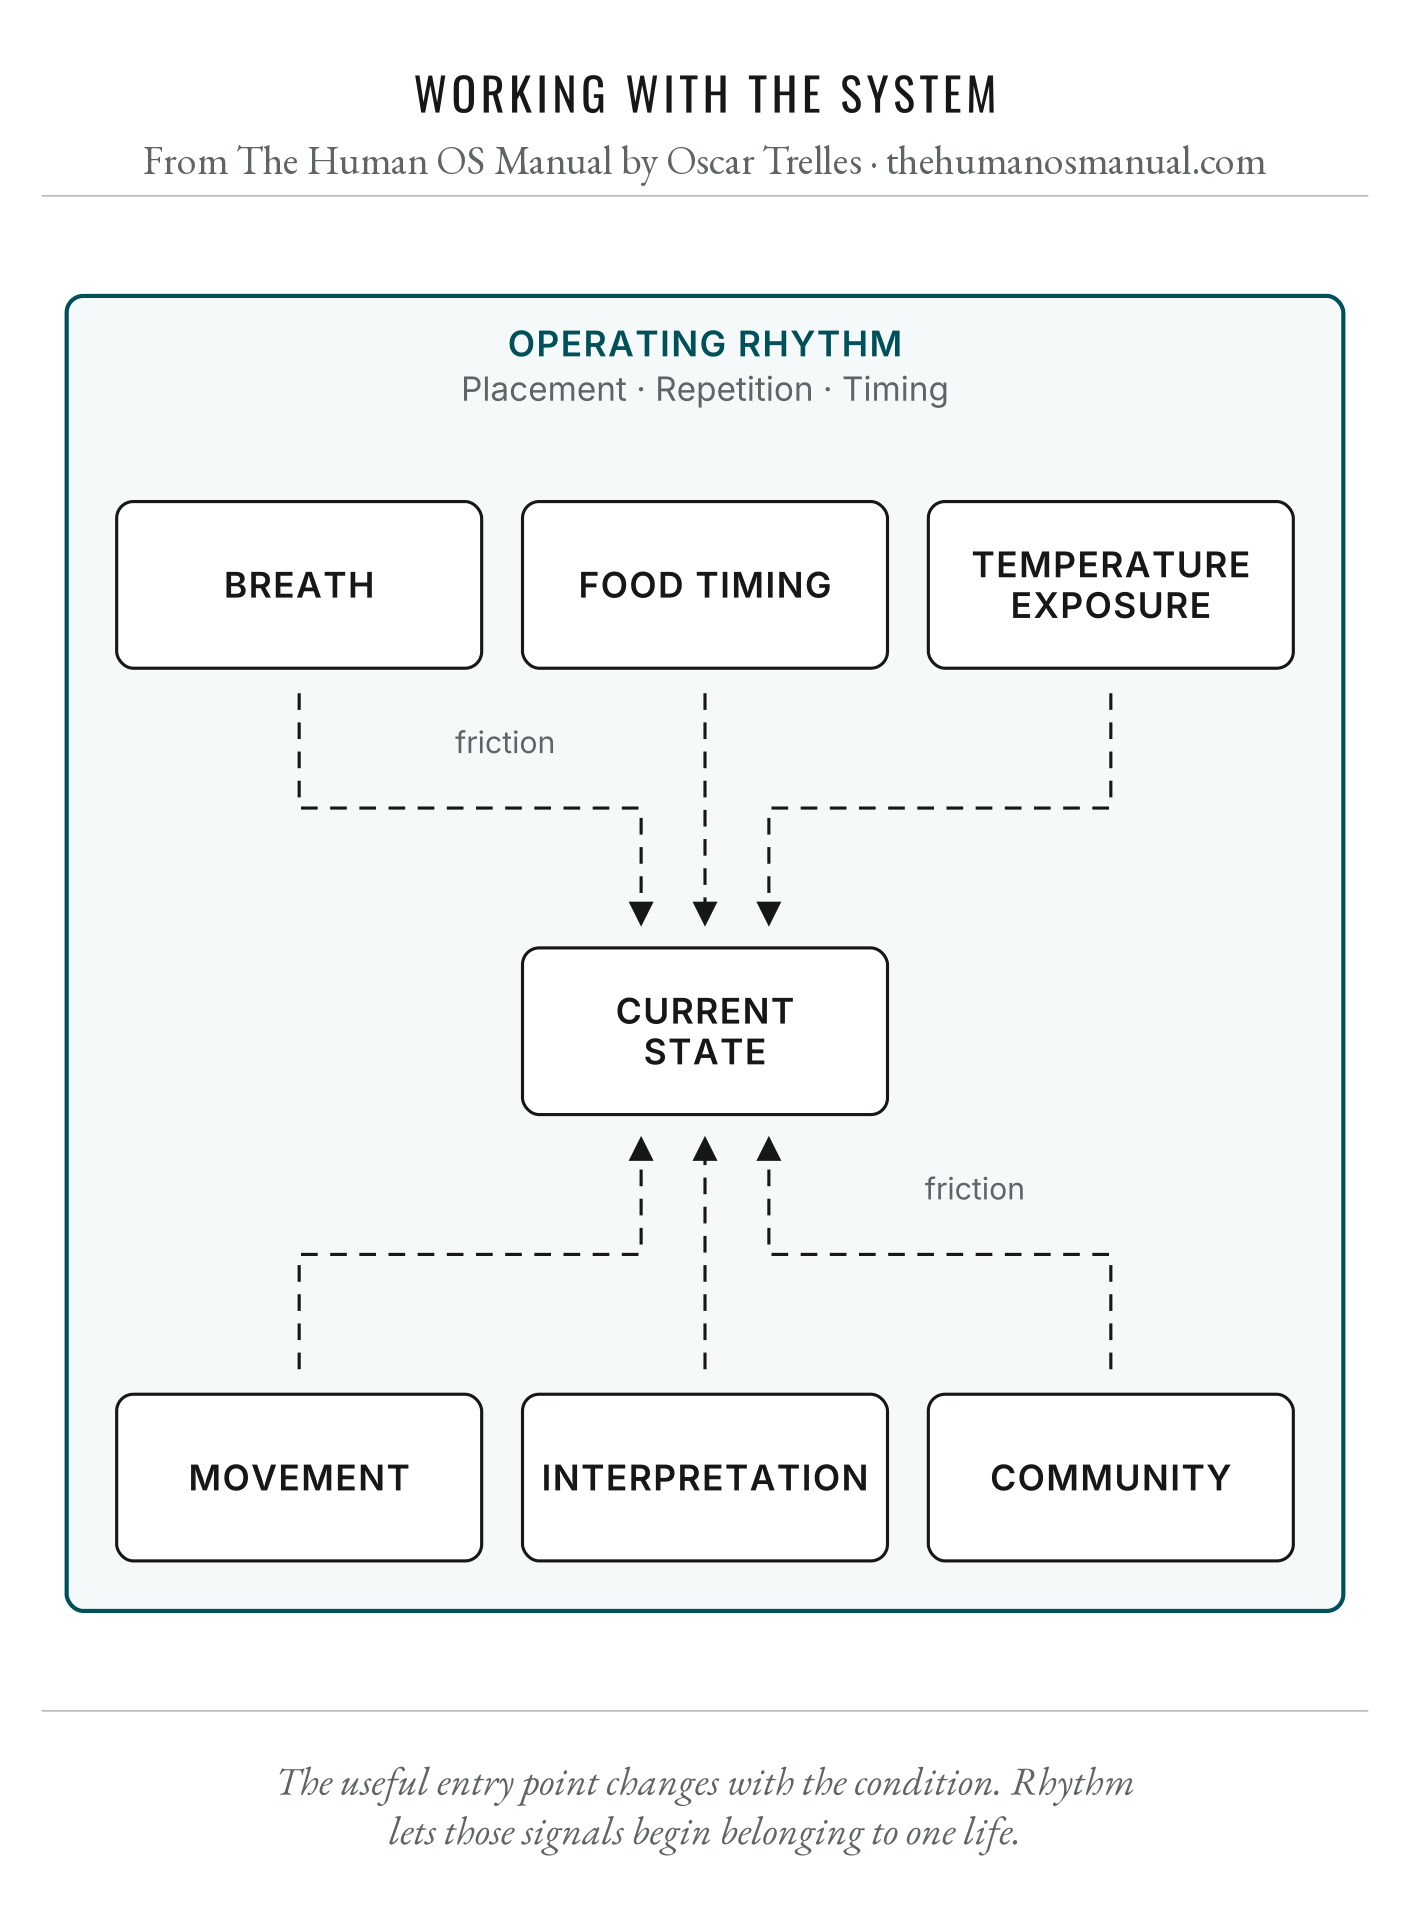
Working With The System

Different entry points, organized inside one life

Figure 22.2, Working With The System. Detailed image description follows.

Image description

Diagram titled Working With the System. Inside an enclosing field labeled Operating Rhythm: Placement · Repetition · Timing, six entry points—breath, food timing, temperature exposure, movement, interpretation, and community—connect through dashed directional paths to a central Current State node. Friction appears along some paths, indicating resistance between an available entry point and the condition being addressed. The caption reads: “The useful entry point changes with the condition. Rhythm gives the signals enough placement and repetition to begin working together.”

In the book

Chapter 22 · Building a Rhythm the Body Can Trust

FIGURE 23.1 · CHAPTER 23

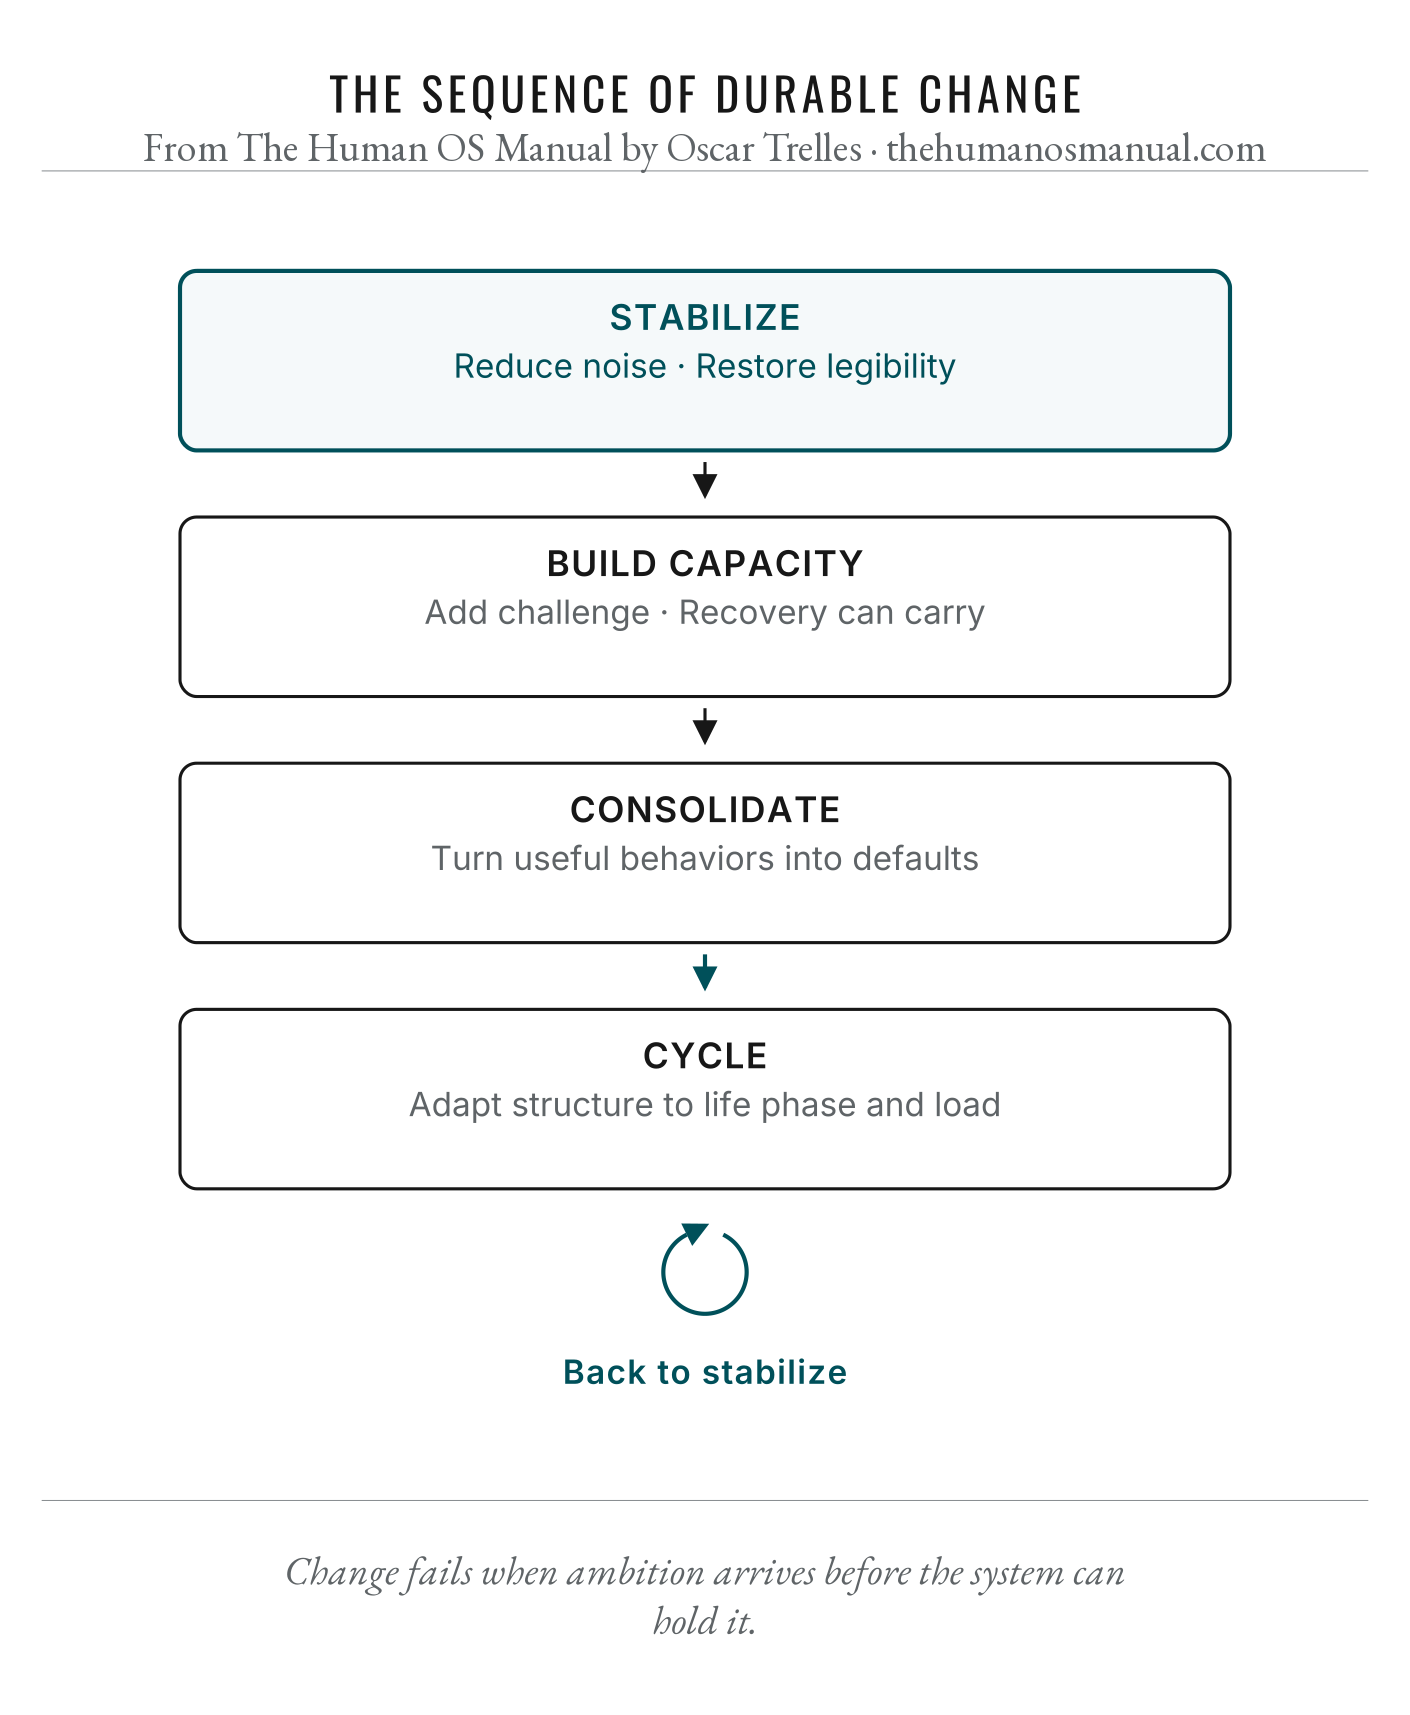
The Sequence Of Durable Change

Figure 23.1, The Sequence Of Durable Change. Detailed image description follows.

Image description

Diagram titled The Sequence of Durable Change. Stabilize reduces noise and restores legibility; build capacity adds challenge recovery can carry; consolidate turns useful behaviors into defaults; cycle adapts structure to life phase and load, then returns to stabilize. Caption: Change fails when intensity outruns sequence.

In the book

Chapter 23 · Why Most Change Fails

FIGURE 28.1 · CHAPTER 28

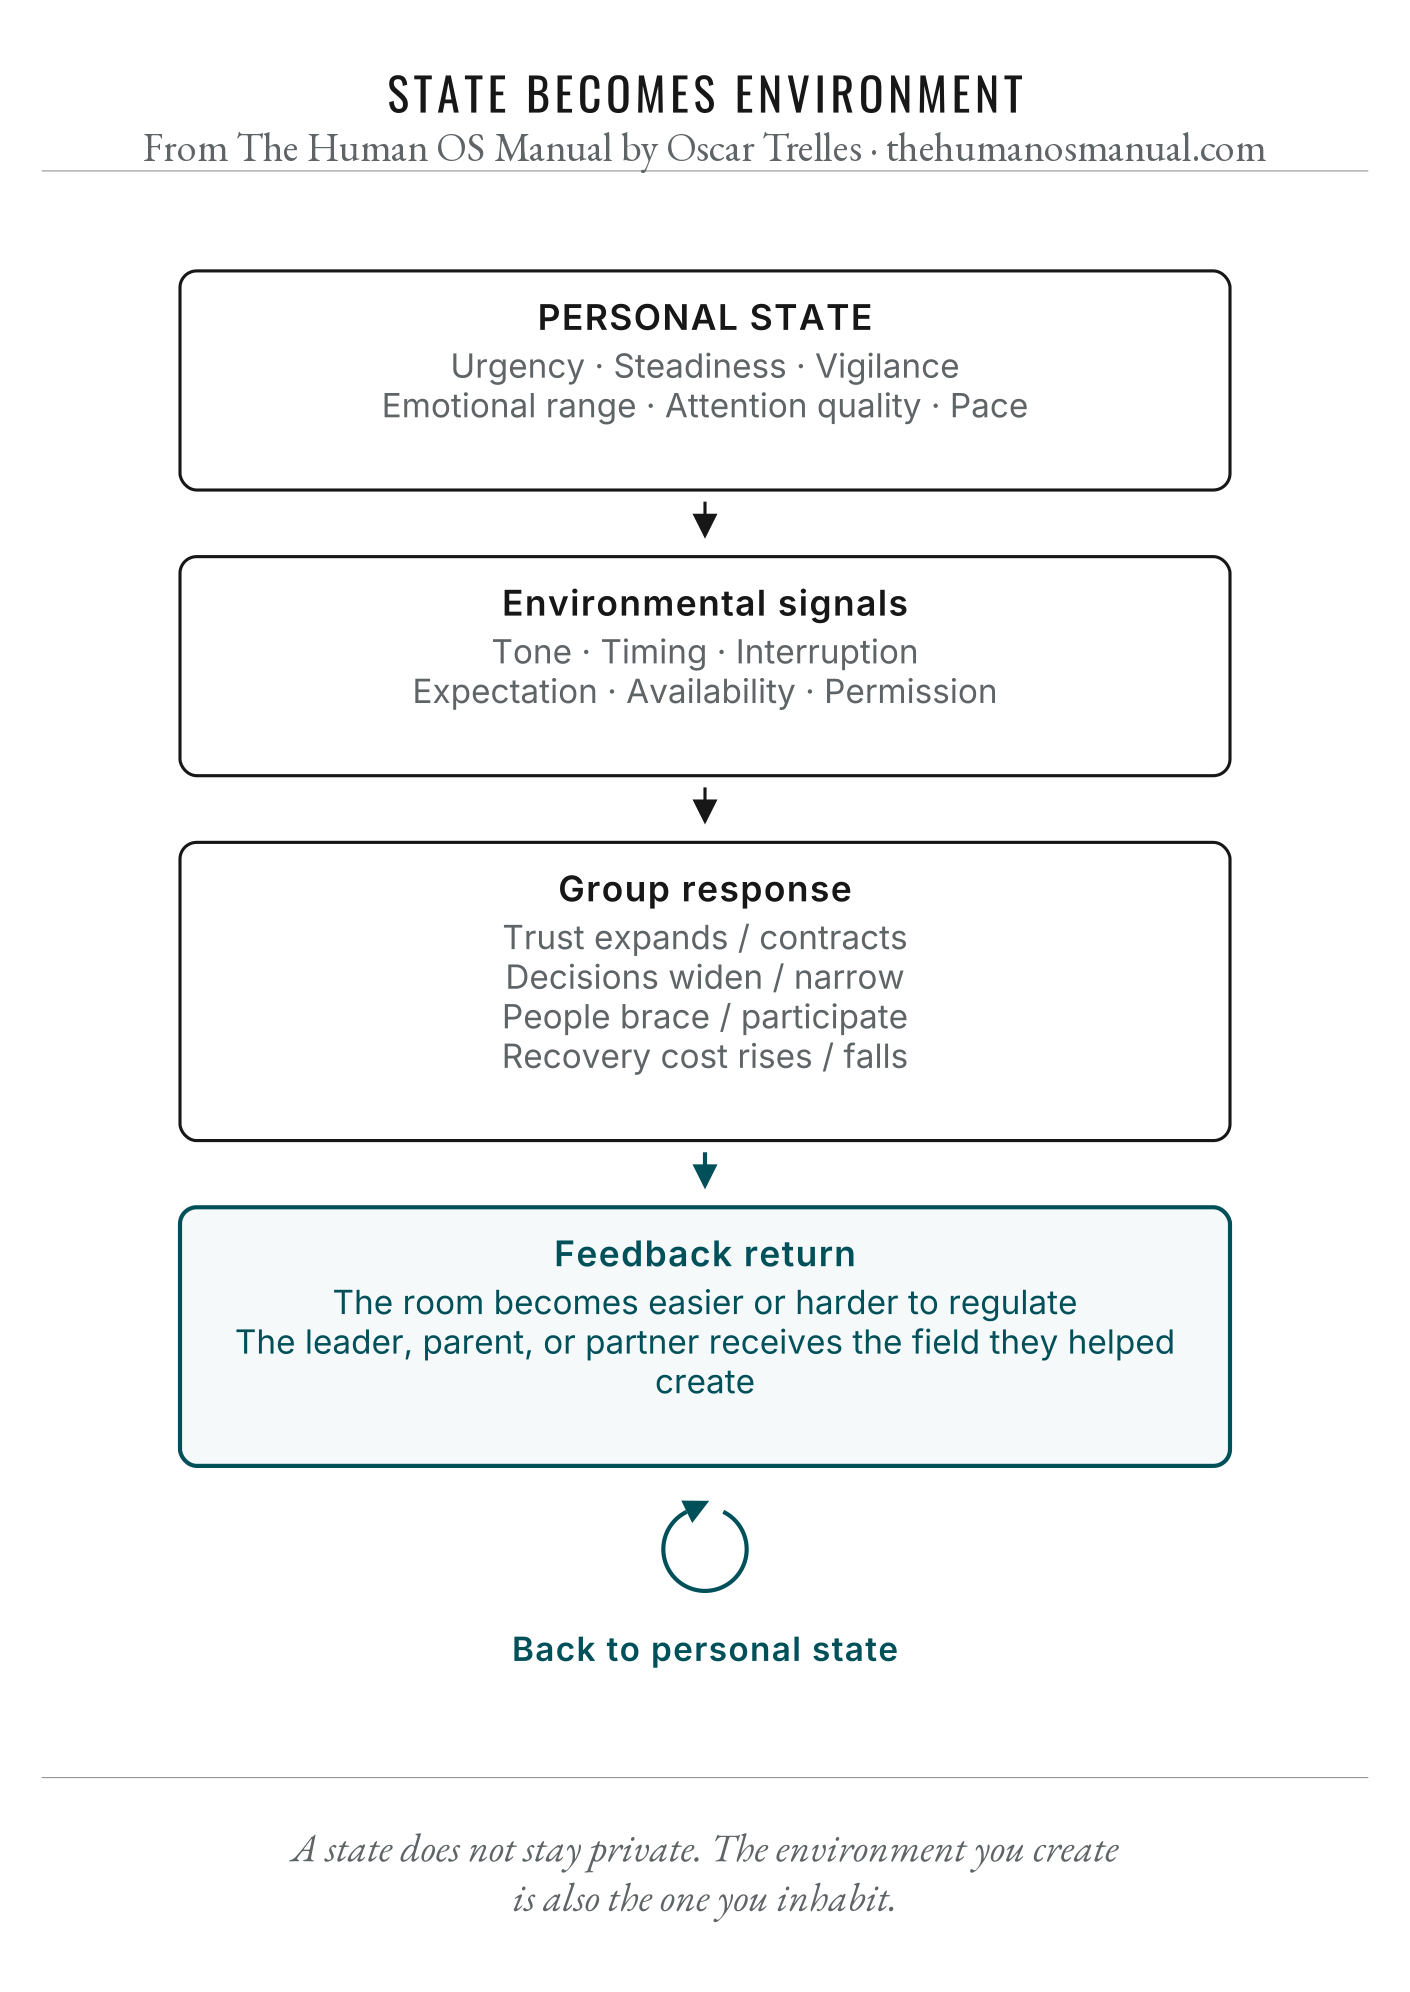
State Becomes Environment

Figure 28.1, State Becomes Environment. Detailed image description follows.

Image description

Diagram titled State Becomes Environment. Personal state—urgency, steadiness, vigilance, emotional range, attention quality, and pace—becomes environmental signals that shape group response, then returns as feedback through the room created around it.

In the book

Chapter 28 · When Your State Becomes the Environment

FIGURE A1.1 · APPENDIX I

The Human Os Reference Map

Figure A1.1, The Human Os Reference Map. Detailed image description follows.

Image description

Diagram titled The Human OS Reference Map. A full architecture links input, state, output, recovery, pattern, and adaptation systems inside awareness and community meta-layers, with arrows showing feedback between signals, behavior, recovery, habits, capacity, and growth over time.

In the book

Appendix I · The Human OS Reference Map

Explore the interactive Reference Map →

Sharing and attribution

These figures may be shared for non-commercial reference and discussion with the attribution intact. The public web versions include attribution as part of the image itself.

When possible, link to this page or the individual figure anchor so readers can see the full description and book context.

Read the figures in context

The Human OS Manual develops the argument, mechanisms, and lived context behind these diagrams.